مثال عملي · Excel وPowerPoint
جدول ميزانية مكتب الإدارة والميزانية إلى مخطط بياني في Excel وعرض تقديمي للإحاطة
تلقى محلل ميزانية ملف Excel للإنفاق الحكومي الأمريكي، من عام 1940 إلى 2031. وطلبوا من استخراج أربعة بنود إنفاق رئيسية ورسمها بيانياً لمديرهم.
قام بتحليل البيانات عبر إنشاء جدول لتكاليف الدفاع وميديكير والضمان الاجتماعي والفوائد للأعوام من 2015 إلى 2031، ورسم مخططًا في ملف Excel نفسه. ثم انتقل المخطط إلى شريحة PowerPoint كمخطط حقيقي وليس كصورة.
1ملف إكسل الأصلي، كما قام المحلل بتحميله
- 2طلبات بلغة بسيطة
- 1تم تعديل ملف Excel ولم يتم استبداله
- 1مجموعة شرائح مبنية منه
- 0الصيغ مكتوبة يدوياً
فتح الملفات الفعلية
هذه هي الملفات الفعلية من التشغيل. قم بتنزيلها وافتحها في Excel أو PowerPoint.
مصدر الملف: OMB Historical Tables, الجدول 3.1، النفقات حسب المجال الرئيسي والوظيفة، ميزانية السنة المالية 2027.
01 · ملف البداية
جدول بيانات حكومي ضخم وغير منظم
يسرد الملف كل نوع من أنواع الإنفاق الفيدرالي من 1940 إلى 2031، سنة واحدة لكل عمود، أي 94 عمودًا. وفيه بعض المطبّات: عمود "TQ" إضافي أُقحم بعد عام 1976، والسنوات بعد عام 2025 مسماة بـ "تقدير 2026" وما إلى ذلك.
589,659| A | B | … | AL | AM | AN | … | BZ | CA | … | CI | CJ | CK | … | CP | |
|---|---|---|---|---|---|---|---|---|---|---|---|---|---|---|---|
| 1 | Table 3.1 - OUTLAYS BY SUPERFUNCTION AND FUNCTION: 1940 - 2031 | … | … | … | … | ||||||||||
| 2 | Superfunction and Function | 1940 | … | 1976 | TQ | 1977 | … | 2015 | 2016 | … | 2024 | 2025 | 2026 estimate | … | 2031 estimate |
| 3 | In millions of dollars: | … | … | … | … | ||||||||||
| 4 | National Defense | 1,660 | … | 89,619 | 22,269 | 97,241 | … | 589,659 | 593,372 | … | 873,523 | 916,140 | 966,396 | … | 1,369,123 |
| 5 | Human resources | 4,139 | … | 203,594 | 52,065 | 221,895 | … | 2,706,828 | 2,820,292 | … | 4,548,904 | 4,706,716 | 5,078,303 | … | 6,347,219 |
| 6 | Education, Training, Employment, and Social Services | 1,972 | … | 18,910 | 5,169 | 21,104 | … | 122,035 | 109,709 | … | 306,370 | 72,042 | 101,970 | … | 133,413 |
| 7 | Health | 55 | … | 15,734 | 3,924 | 17,302 | … | 482,257 | 511,325 | … | 911,290 | 978,511 | 1,047,526 | … | 1,143,249 |
| 8 | Medicare | .......... | … | 15,834 | 4,264 | 19,345 | … | 546,202 | 594,536 | … | 874,133 | 996,718 | 1,070,248 | … | 1,573,538 |
| 9 | Income Security | 1,514 | … | 60,784 | 14,981 | 61,045 | … | 508,800 | 514,098 | … | 670,548 | 701,609 | 741,971 | … | 743,752 |
| 10 | Social Security | 28 | … | 73,899 | 19,763 | 85,061 | … | 887,753 | 916,067 | … | 1,460,918 | 1,580,673 | 1,676,441 | … | 2,151,475 |
| … | |||||||||||||||
| 22 | Net interest | 899 | … | 26,727 | 6,949 | 29,901 | … | 223,181 | 240,033 | … | 879,879 | 970,065 | 1,016,650 | … | 1,363,769 |
| … | |||||||||||||||
| 35 | Total, Federal outlays | 9,468 | … | 371,792 | 95,975 | 409,218 | … | 3,691,850 | 3,852,615 | … | 6,735,261 | 7,011,105 | 7,540,434 | … | 9,279,779 |
| … | |||||||||||||||
| 39 | National defense | 17.5 | … | 24.1 | 23.2 | 23.8 | … | 16.0 | 15.4 | … | 13.0 | 13.1 | 12.8 | … | 14.8 |
| 42 | Net interest | 9.5 | … | 7.2 | 7.2 | 7.3 | … | 6.0 | 6.2 | … | 13.1 | 13.8 | 13.5 | … | 14.7 |
02 · الطلب 1
أضف جدولًا ملخصًا ومخططًا
ما كتبه المحلل
In the attached OMB Historical Table 3.1 (FY2027 Budget), please add a new sheet called 'Big Four' and leave the 'Table' sheet exactly as it is. On the new sheet:
1. Column A: fiscal years 2015 to 2031, one row per year (17 rows).
2. Columns B-E: National Defense (row 4), Medicare (row 8), Social Security (row 10) and Net interest (row 22) from the Table sheet, converted from $ millions to $ billions, one decimal. Use formulas that point at the Table sheet if you can.
3. Column F: 'Actual' for 2015-2025 and 'Estimate' for 2026-2031 (the columns headed '2026 estimate' to '2031 estimate').
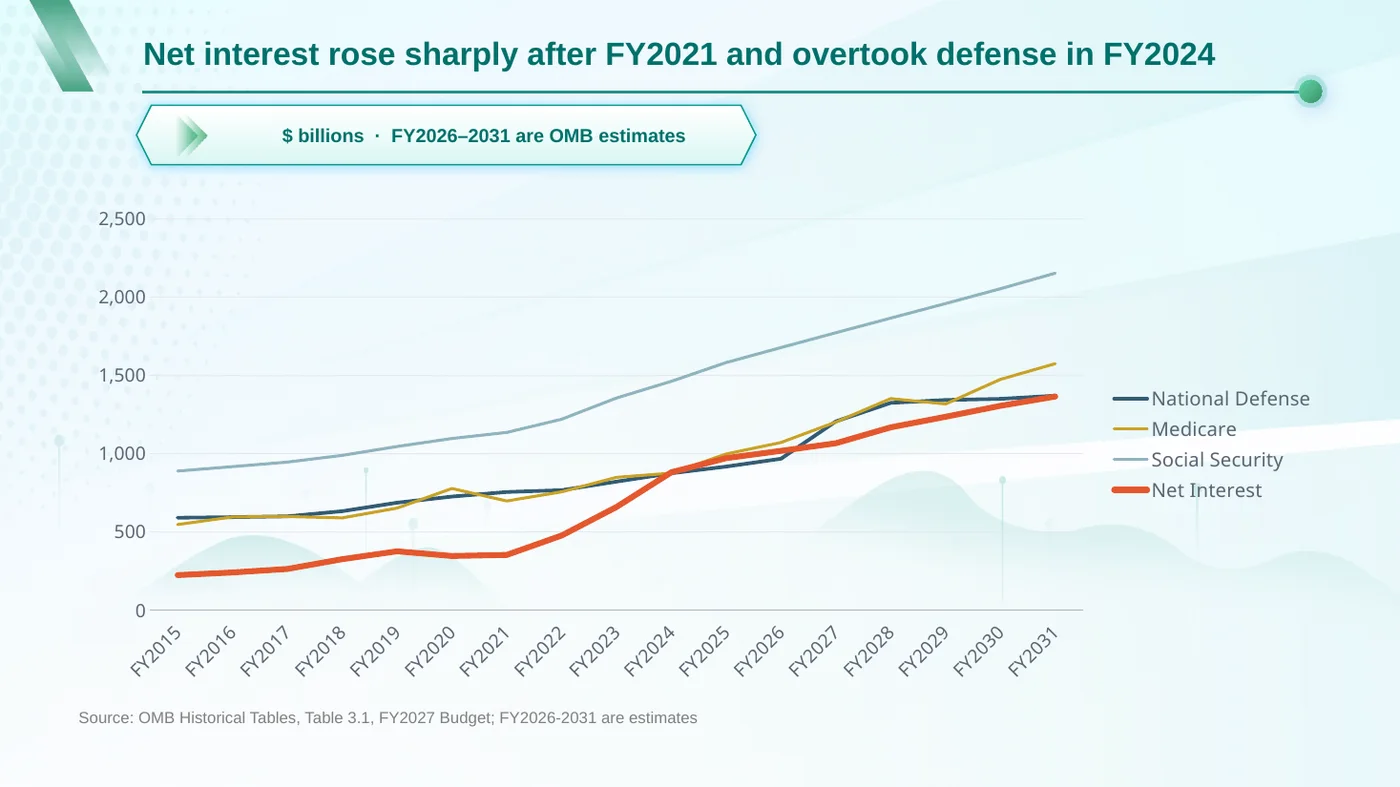
4. A native Excel line chart of the four series with years on the x-axis, titled 'Federal outlays by function, FY2015-FY2031 ($ billions)', with a note that 2026-2031 are OMB estimates.
ما عملته
- تم العمل داخل ملف Excel المُحمَّل. ولم يتم إنشاء ملف جديد.
- تم التحقق من تسميات السنوات أولاً، بحيث يصطف عام 2015 مع العمود الصحيح على الرغم من وجود عمود TQ الإضافي.
- تمت إضافة ورقة عمل جديدة باسم «Big Four»: صف واحد لكل عام من 2015 إلى 2031، وأربعة بنود إنفاق بالمليارات، وتسمية «فعلي» أو «تقديري».
- تم ملؤه بصيغ تشير إلى ورقة العمل الأصلية، بحيث يمكن تتبع كل رقم. انقر فوق خلية خضراء أدناه لرؤية واحدة.
- تم رسم مخطط خطي حقيقي في Excel يمكنك النقر فوقه وتعديله.
- لم يتم لمس ورقة العمل الأصلية. لقد تحققنا من كل خلية.
=ROUND(Table!BZ4/1000,1)| A | B | C | D | E | F | |
|---|---|---|---|---|---|---|
| 1 | Fiscal Year | National Defense ($ billions) | Medicare ($ billions) | Social Security ($ billions) | Net Interest ($ billions) | Type |
| 2 | 2015 | 589.7 | 546.2 | 887.8 | 223.2 | Actual |
| 3 | 2016 | 593.4 | 594.5 | 916.1 | 240 | Actual |
| 4 | 2017 | 598.7 | 597.3 | 944.9 | 262.6 | Actual |
| 5 | 2018 | 631.3 | 588.7 | 987.8 | 325 | Actual |
| 6 | 2019 | 685.7 | 651 | 1044.4 | 375.2 | Actual |
| 7 | 2020 | 724.6 | 776.2 | 1095.8 | 345.5 | Actual |
| 8 | 2021 | 753.9 | 696.5 | 1134.6 | 352.3 | Actual |
| 9 | 2022 | 765.6 | 755.1 | 1218.7 | 475.9 | Actual |
| 10 | 2023 | 820.3 | 847.5 | 1354.3 | 658.3 | Actual |
| 11 | 2024 | 873.5 | 874.1 | 1460.9 | 879.9 | Actual |
| 12 | 2025 | 916.1 | 996.7 | 1580.7 | 970.1 | Actual |
| 13 | 2026 | 966.4 | 1070.2 | 1676.4 | 1016.7 | Estimate |
| 14 | 2027 | 1205 | 1200.8 | 1771.1 | 1065.4 | Estimate |
| 15 | 2028 | 1323.2 | 1350.5 | 1864.4 | 1167 | Estimate |
| 16 | 2029 | 1341.6 | 1316.2 | 1957.3 | 1234.6 | Estimate |
| 17 | 2030 | 1348.8 | 1473.4 | 2052.1 | 1304.5 | Estimate |
| 18 | 2031 | 1369.1 | 1573.5 | 2151.5 | 1363.8 | Estimate |
| 20 | Note: 2026-2031 are OMB estimates. | |||||
Federal outlays by function, FY2015-FY2031 ($ billions)
- National Defense ($ billions)
- Medicare ($ billions)
- Social Security ($ billions)
- Net Interest ($ billions)
تحقق الذكاء الاصطناعي من الأرقام مرتين: تكاليف الدفاع لعام 2015 بلغت 589.7، والرعاية الصحية (ميديكير) 546.2، الضمان الاجتماعي 887.8 والفوائد 223.2 (مليار) وكلها تتطابق مع الأرقام الحكومية.
03 · الطلب 2
الآن حوله إلى ثلاث شرائح
ما كتبه المحلل
Now build a 3-slide PowerPoint for the Deputy Secretary from the 'Big Four' sheet:
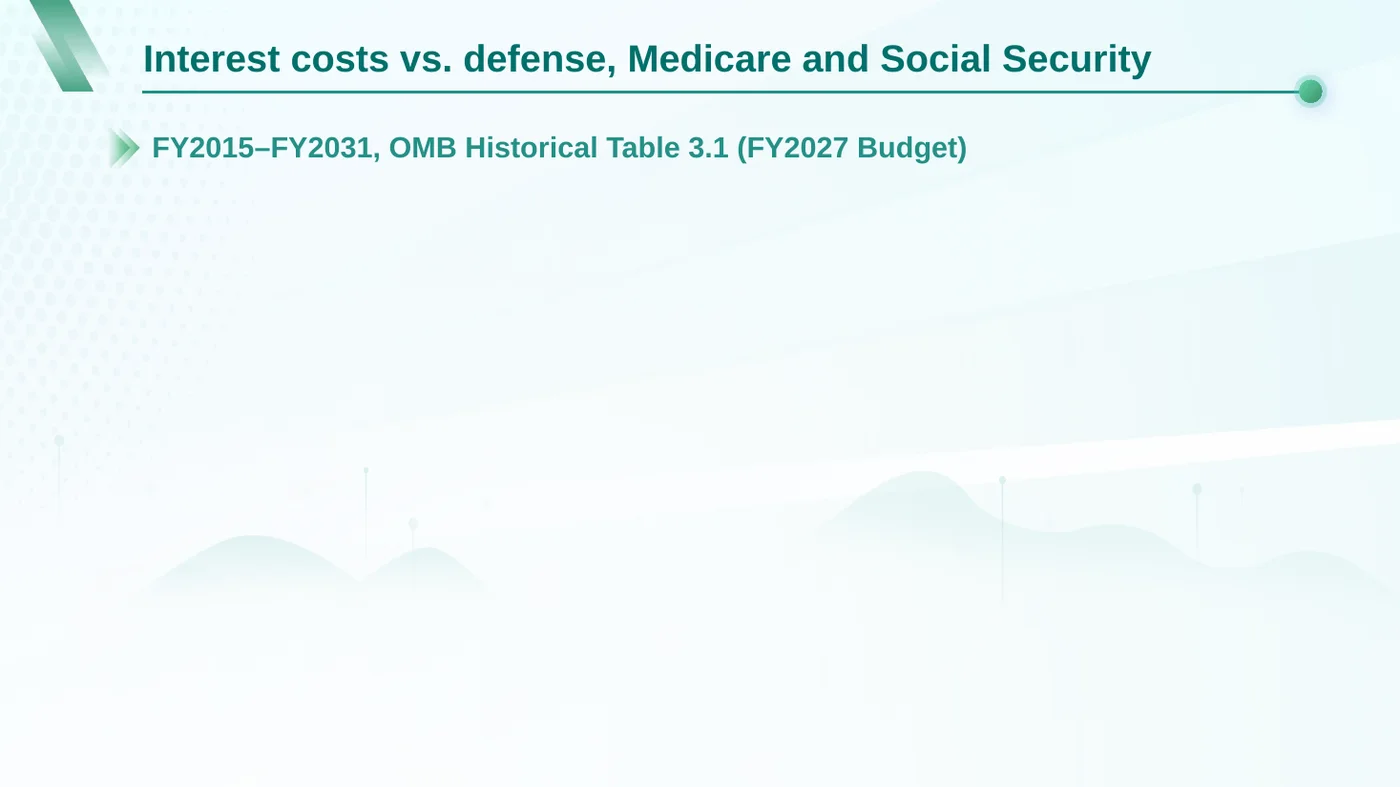
1. Title slide: 'Interest costs vs. defense, Medicare and Social Security', subtitle 'FY2015-FY2031, OMB Historical Table 3.1 (FY2027 Budget)'.
2. The line chart, with a one-line headline stating what it shows, and 'Source: OMB Historical Tables, Table 3.1, FY2027 Budget; FY2026-2031 are estimates' at the bottom.
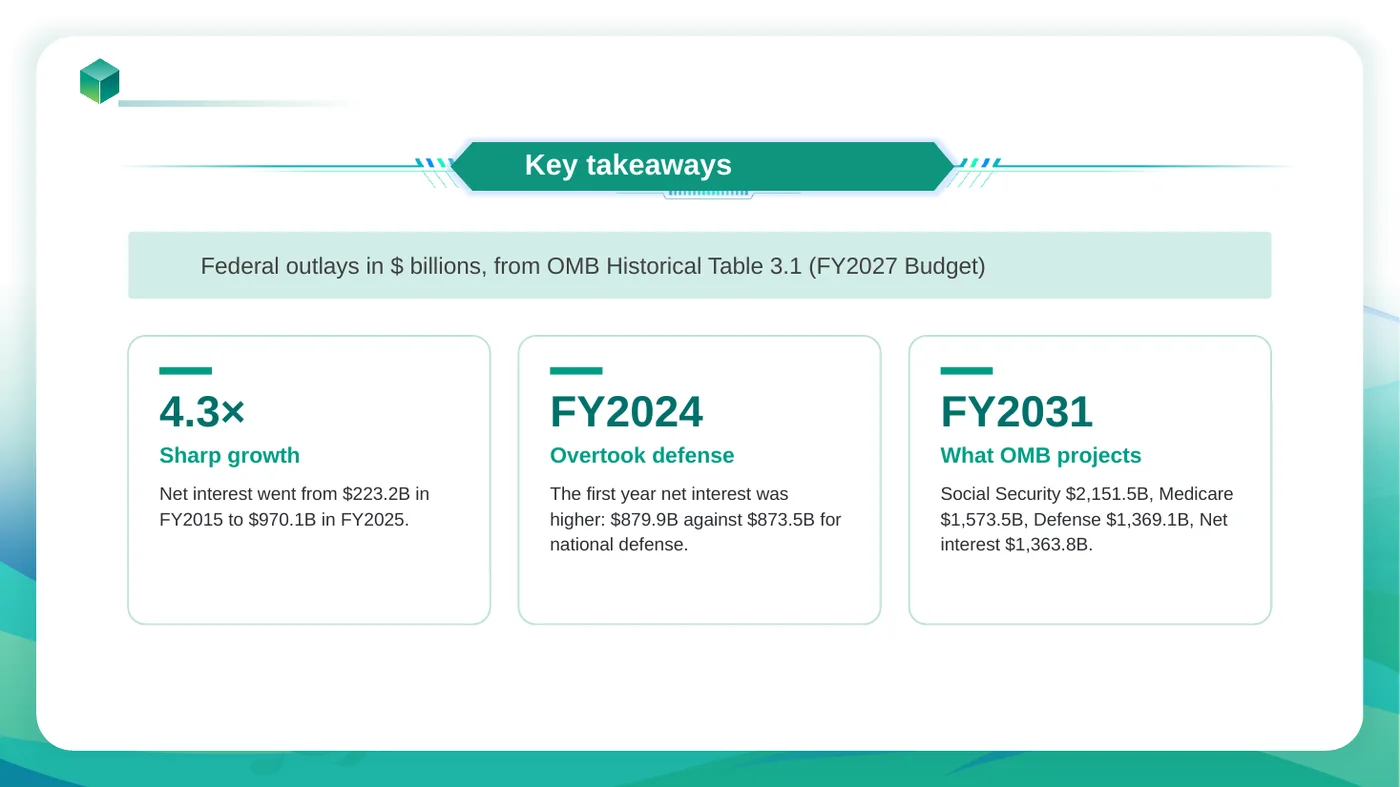
3. Three takeaways, each with figures from the sheet: (a) how net interest grew from FY2015 to FY2025; (b) the first fiscal year in which net interest exceeded national defense, with both amounts; (c) what OMB projects for the four lines in FY2031.

Plain government style, no stock images.
ما عملته
- قرأ ورقة العمل «Big Four» التي أنشأها للتو، بحيث تعرض الشرائح وجدول البيانات الأرقام نفسها.
- السماح للمحلل باختيار تصميم من مكتبة القوالب الخاصة به.
- وضع المخطط على الشريحة 2 كمخطط PowerPoint حقيقي، مع بياناته بداخله. انقر بزر الماوس الأيمن فوقه واختر تحرير البيانات.
- كتب النقاط الرئيسية من الأرقام: نمت تكاليف الفوائد بـ 4.3 أضعاف من 2015 إلى 2025، وتجاوزت الإنفاق الدفاعي لأول مرة في عام 2024.
ملفاتك، تُعدَّل في مكانها
تقرأ معظم أدوات الذكاء الاصطناعي جدول البيانات الخاص بك وتُرجع جدولاً جديداً. يفتح الملف الذي قمت بتحميله، ويغير فقط ما طلبتَه، ويحتفظ بكل نسخة سابقة.
تابع القراءة