ឧទាហរណ៍ជាក់ស្តែង · EXCEL និង POWERPOINT
តារាងថវិកា OMB ទៅជាគំនូសតាង Excel និងសំណុំឯកសារបង្ហាញព័ត៌មានសង្ខេប
អ្នកវិភាគថវិកាម្នាក់បានទទួលឯកសារ Excel ស្តីពីការចំណាយរបស់រដ្ឋាភិបាលសហរដ្ឋអាមេរិក ពីឆ្នាំ១៩៤០ ដល់ ២០៣១។ ពួកគាត់បានស្នើឱ្យ ទាញយកបន្ទាត់ចំណាយធំៗចំនួនបួន និងបង្កើតក្រាហ្វសម្រាប់ថ្នាក់លើរបស់ពួកគេ។
បានវិភាគទិន្នន័យដោយបង្កើតតារាងនៃការចំណាយលើវិស័យការពារជាតិ មេឌីខែដ សន្តិសុខសង្គម និងការប្រាក់សម្រាប់ឆ្នាំ២០១៥ ដល់ ២០៣១ ហើយបានគូរក្រាហ្វនៅក្នុងឯកសារ Excel ដូចគ្នា។ បន្ទាប់មកក្រាហ្វបានចូលទៅក្នុងស្លាយ PowerPoint ជាក្រាហ្វពិតប្រាកដ មិនមែនជារូបភាពទេ។
1ឯកសារ Excel ដើម ដូចដែលអ្នកវិភាគបានផ្ទុកឡើង
- 2សំណើជាភាសាអង់គ្លេសធម្មតា
- 1ឯកសារ Excel ត្រូវបានកែសម្រួល មិនមែនជំនួសទេ។
- 1បណ្តុំស្លាយដែលបានបង្កើតពីវា
- 0រូបមន្តត្រូវបានវាយដោយដៃ
បើកឯកសារពិតប្រាកដ
ទាំងនេះគឺជាឯកសារពិតប្រាកដពីដំណើរការ។ ទាញយកវា ហើយបើកក្នុង Excel ឬ PowerPoint។
ប្រភពដើមនៃឯកសារ៖ OMB Historical Tables, តារាងទី ៣.១ ការចំណាយតាមមុខងារជាន់ខ្ពស់ និងមុខងារ ថវិកាឆ្នាំសារពើពន្ធ ២០២៧។
01 · ឯកសារចាប់ផ្តើម
តារាងទិន្នន័យរដ្ឋាភិបាលដ៏ធំ និងស្មុគស្មាញ
ឯកសាររាយបញ្ជីការចំណាយរបស់រដ្ឋាភិបាលគ្រប់ប្រភេទពីឆ្នាំ១៩៤០ ដល់ ២០៣១ ក្នុងមួយឆ្នាំក្នុងមួយជួរឈរ។ នោះគឺជា ៩៤ ជួរឈរ។ វាមានឧបសគ្គបន្តិចបន្តួច៖ ជួរឈរ "TQ" បន្ថែមដែលត្រូវបានបញ្ចូលបន្ទាប់ពីឆ្នាំ១៩៧៦ និងឆ្នាំបន្ទាប់ពីឆ្នាំ២០២៥ ដែលមានស្លាកថា "2026 estimate" និងបន្តបន្ទាប់ទៀត។
589,659| A | B | … | AL | AM | AN | … | BZ | CA | … | CI | CJ | CK | … | CP | |
|---|---|---|---|---|---|---|---|---|---|---|---|---|---|---|---|
| 1 | Table 3.1 - OUTLAYS BY SUPERFUNCTION AND FUNCTION: 1940 - 2031 | … | … | … | … | ||||||||||
| 2 | Superfunction and Function | 1940 | … | 1976 | TQ | 1977 | … | 2015 | 2016 | … | 2024 | 2025 | 2026 estimate | … | 2031 estimate |
| 3 | In millions of dollars: | … | … | … | … | ||||||||||
| 4 | National Defense | 1,660 | … | 89,619 | 22,269 | 97,241 | … | 589,659 | 593,372 | … | 873,523 | 916,140 | 966,396 | … | 1,369,123 |
| 5 | Human resources | 4,139 | … | 203,594 | 52,065 | 221,895 | … | 2,706,828 | 2,820,292 | … | 4,548,904 | 4,706,716 | 5,078,303 | … | 6,347,219 |
| 6 | Education, Training, Employment, and Social Services | 1,972 | … | 18,910 | 5,169 | 21,104 | … | 122,035 | 109,709 | … | 306,370 | 72,042 | 101,970 | … | 133,413 |
| 7 | Health | 55 | … | 15,734 | 3,924 | 17,302 | … | 482,257 | 511,325 | … | 911,290 | 978,511 | 1,047,526 | … | 1,143,249 |
| 8 | Medicare | .......... | … | 15,834 | 4,264 | 19,345 | … | 546,202 | 594,536 | … | 874,133 | 996,718 | 1,070,248 | … | 1,573,538 |
| 9 | Income Security | 1,514 | … | 60,784 | 14,981 | 61,045 | … | 508,800 | 514,098 | … | 670,548 | 701,609 | 741,971 | … | 743,752 |
| 10 | Social Security | 28 | … | 73,899 | 19,763 | 85,061 | … | 887,753 | 916,067 | … | 1,460,918 | 1,580,673 | 1,676,441 | … | 2,151,475 |
| … | |||||||||||||||
| 22 | Net interest | 899 | … | 26,727 | 6,949 | 29,901 | … | 223,181 | 240,033 | … | 879,879 | 970,065 | 1,016,650 | … | 1,363,769 |
| … | |||||||||||||||
| 35 | Total, Federal outlays | 9,468 | … | 371,792 | 95,975 | 409,218 | … | 3,691,850 | 3,852,615 | … | 6,735,261 | 7,011,105 | 7,540,434 | … | 9,279,779 |
| … | |||||||||||||||
| 39 | National defense | 17.5 | … | 24.1 | 23.2 | 23.8 | … | 16.0 | 15.4 | … | 13.0 | 13.1 | 12.8 | … | 14.8 |
| 42 | Net interest | 9.5 | … | 7.2 | 7.2 | 7.3 | … | 6.0 | 6.2 | … | 13.1 | 13.8 | 13.5 | … | 14.7 |
02 · សំណើទី ១
បន្ថែមតារាងសង្ខេប និងក្រាហ្វមួយ
អ្វីដែលអ្នកវិភាគបានវាយបញ្ចូល
In the attached OMB Historical Table 3.1 (FY2027 Budget), please add a new sheet called 'Big Four' and leave the 'Table' sheet exactly as it is. On the new sheet:
1. Column A: fiscal years 2015 to 2031, one row per year (17 rows).
2. Columns B-E: National Defense (row 4), Medicare (row 8), Social Security (row 10) and Net interest (row 22) from the Table sheet, converted from $ millions to $ billions, one decimal. Use formulas that point at the Table sheet if you can.
3. Column F: 'Actual' for 2015-2025 and 'Estimate' for 2026-2031 (the columns headed '2026 estimate' to '2031 estimate').
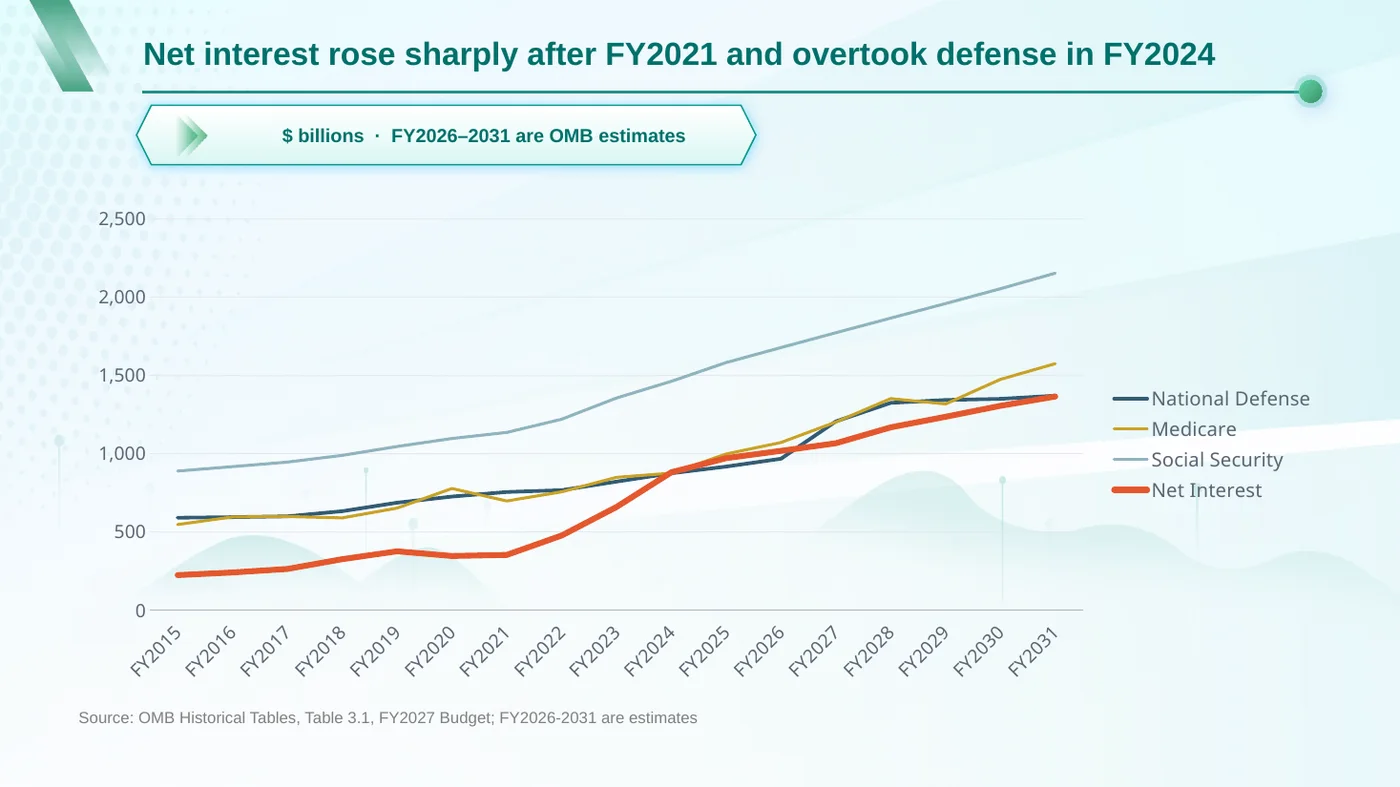
4. A native Excel line chart of the four series with years on the x-axis, titled 'Federal outlays by function, FY2015-FY2031 ($ billions)', with a note that 2026-2031 are OMB estimates.
អ្វីដែល បានធ្វើ
- បានធ្វើការនៅខាងក្នុងឯកសារ Excel ដែលបានអាប់ឡូត។ វាមិនបានបង្កើតឯកសារថ្មីទេ។
- បានពិនិត្យស្លាកឆ្នាំជាមុនសិន ដូច្នេះឆ្នាំ២០១៥ ត្រូវគ្នាជាមួយនឹងជួរឈរត្រឹមត្រូវ ទោះបីជាមានជួរឈរ TQ បន្ថែមទៀតក៏ដោយ។
- បានបន្ថែមសន្លឹកកិច្ចការថ្មីមួយ "Big Four"៖ ជួរដេកមួយក្នុងមួយឆ្នាំពីឆ្នាំ២០១៥ ដល់ ២០៣១ បន្ទាត់ចំណាយចំនួនបួនជាពាន់លាន និងស្លាក "Actual" ឬ "Estimate"។
- បានបំពេញវាដោយរូបមន្តដែលចង្អុលទៅសន្លឹកកិច្ចការដើមវិញ ដូច្នេះរាល់លេខទាំងអស់អាចតាមដានបាន។ សូមចុចលើក្រឡាពណ៌បៃតងខាងក្រោមដើម្បីមើលមួយ។
- បានគូរក្រាហ្វបន្ទាត់ Excel ពិតប្រាកដដែលអ្នកអាចចុច និងកែសម្រួលបាន។
- មិនបានប៉ះពាល់ដល់សន្លឹកកិច្ចការដើមទេ។ យើងបានពិនិត្យរាល់ក្រឡាទាំងអស់។
=ROUND(Table!BZ4/1000,1)| A | B | C | D | E | F | |
|---|---|---|---|---|---|---|
| 1 | Fiscal Year | National Defense ($ billions) | Medicare ($ billions) | Social Security ($ billions) | Net Interest ($ billions) | Type |
| 2 | 2015 | 589.7 | 546.2 | 887.8 | 223.2 | Actual |
| 3 | 2016 | 593.4 | 594.5 | 916.1 | 240 | Actual |
| 4 | 2017 | 598.7 | 597.3 | 944.9 | 262.6 | Actual |
| 5 | 2018 | 631.3 | 588.7 | 987.8 | 325 | Actual |
| 6 | 2019 | 685.7 | 651 | 1044.4 | 375.2 | Actual |
| 7 | 2020 | 724.6 | 776.2 | 1095.8 | 345.5 | Actual |
| 8 | 2021 | 753.9 | 696.5 | 1134.6 | 352.3 | Actual |
| 9 | 2022 | 765.6 | 755.1 | 1218.7 | 475.9 | Actual |
| 10 | 2023 | 820.3 | 847.5 | 1354.3 | 658.3 | Actual |
| 11 | 2024 | 873.5 | 874.1 | 1460.9 | 879.9 | Actual |
| 12 | 2025 | 916.1 | 996.7 | 1580.7 | 970.1 | Actual |
| 13 | 2026 | 966.4 | 1070.2 | 1676.4 | 1016.7 | Estimate |
| 14 | 2027 | 1205 | 1200.8 | 1771.1 | 1065.4 | Estimate |
| 15 | 2028 | 1323.2 | 1350.5 | 1864.4 | 1167 | Estimate |
| 16 | 2029 | 1341.6 | 1316.2 | 1957.3 | 1234.6 | Estimate |
| 17 | 2030 | 1348.8 | 1473.4 | 2052.1 | 1304.5 | Estimate |
| 18 | 2031 | 1369.1 | 1573.5 | 2151.5 | 1363.8 | Estimate |
| 20 | Note: 2026-2031 are OMB estimates. | |||||
Federal outlays by function, FY2015-FY2031 ($ billions)
- National Defense ($ billions)
- Medicare ($ billions)
- Social Security ($ billions)
- Net Interest ($ billions)
AI បានពិនិត្យផ្ទៀងផ្ទាត់តួលេខពីរដង៖ ការចំណាយលើវិស័យការពារជាតិឆ្នាំ២០១៥ ៥៨៩.៧, មេឌីខែដ ៥៤៦.២, សន្តិសុខសង្គម ៨៨៧.៨ និងការប្រាក់ ២២៣.២ (ជាពាន់លាន) ទាំងអស់ត្រូវគ្នានឹងតួលេខរបស់រដ្ឋាភិបាល។
03 · សំណើទី ២
ឥឡូវនេះ ប្តូរវាទៅជាស្លាយចំនួនបី
អ្វីដែលអ្នកវិភាគបានវាយបញ្ចូល
Now build a 3-slide PowerPoint for the Deputy Secretary from the 'Big Four' sheet:
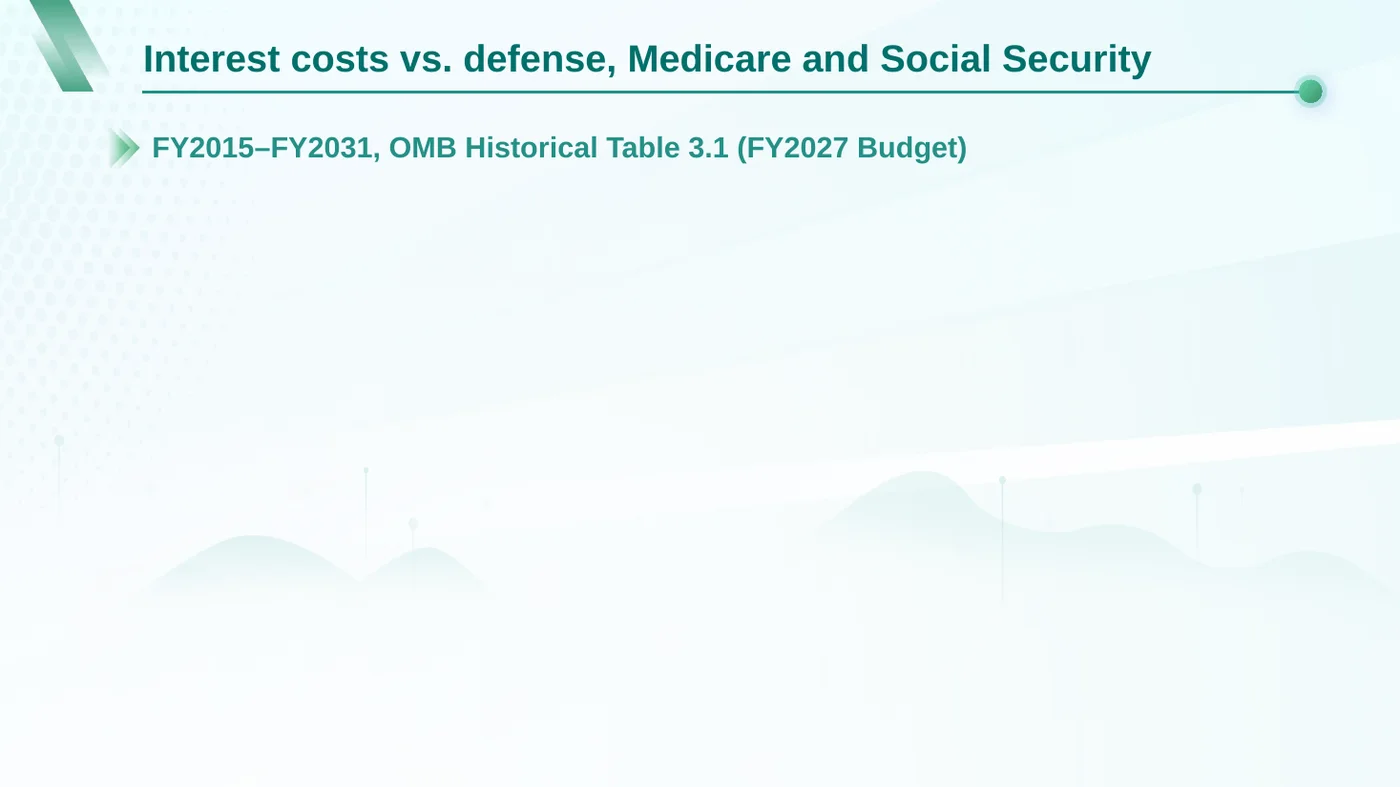
1. Title slide: 'Interest costs vs. defense, Medicare and Social Security', subtitle 'FY2015-FY2031, OMB Historical Table 3.1 (FY2027 Budget)'.
2. The line chart, with a one-line headline stating what it shows, and 'Source: OMB Historical Tables, Table 3.1, FY2027 Budget; FY2026-2031 are estimates' at the bottom.
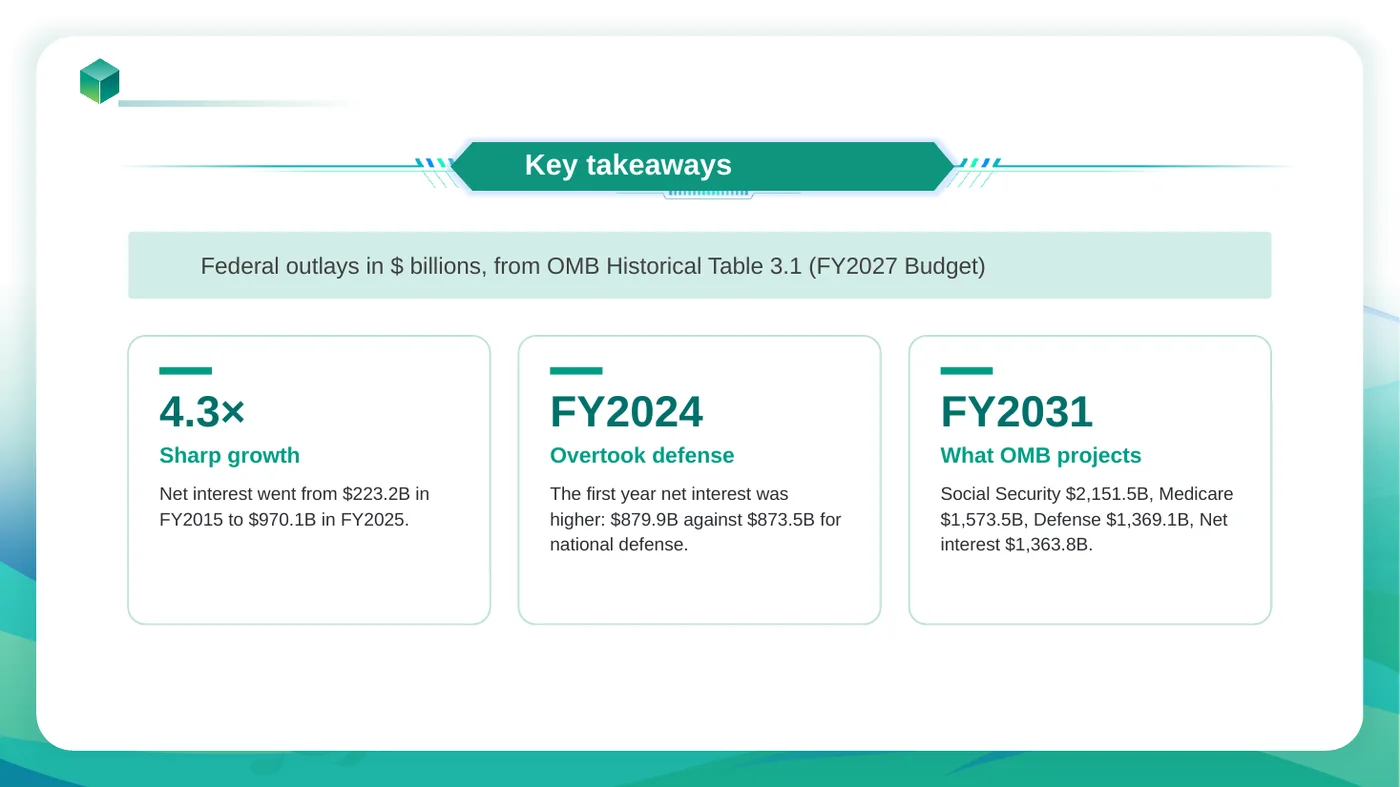
3. Three takeaways, each with figures from the sheet: (a) how net interest grew from FY2015 to FY2025; (b) the first fiscal year in which net interest exceeded national defense, with both amounts; (c) what OMB projects for the four lines in FY2031.

Plain government style, no stock images.
អ្វីដែល បានធ្វើ
- បានអានសន្លឹកកិច្ចការ "Big Four" ដែលទើបតែបង្កើតឡើង ដូច្នេះស្លាយ និងតារាងទិន្នន័យបង្ហាញតួលេខដូចគ្នា។
- អនុញ្ញាតឱ្យអ្នកវិភាគជ្រើសរើសការរចនាពីបណ្ណាល័យគំរូរបស់វា។
- បានដាក់ក្រាហ្វនៅលើស្លាយទី 2 ជាក្រាហ្វ PowerPoint ពិតប្រាកដ ដែលមានទិន្នន័យនៅខាងក្នុង។ ចុចខាងស្តាំលើវា ហើយជ្រើសរើស Edit Data។
- បានសរសេរចំណុចសំខាន់ៗពីតួលេខ៖ ការចំណាយលើការប្រាក់បានកើនឡើង ៤.៣ ដងពីឆ្នាំ២០១៥ ដល់ ២០២៥ ហើយបានលើសការចំណាយលើវិស័យការពារជាតិជាលើកដំបូងក្នុងឆ្នាំ២០២៤។
ឯកសាររបស់អ្នក ត្រូវបានកែសម្រួលនៅកន្លែងដែលវាស្ថិតនៅ
ឧបករណ៍ AI ភាគច្រើនអានតារាងទិន្នន័យរបស់អ្នក ហើយផ្តល់ត្រឡប់មកវិញនូវតារាងថ្មីមួយ។ បើកឯកសារដែលអ្នកបានអាប់ឡូត កែប្រែតែអ្វីដែលអ្នកបានស្នើ និងរក្សាទុកគ្រប់ជំនាន់មុនៗទាំងអស់។
អានបន្ត
អានឧទាហរណ៍ការងារជាក់ស្តែងមួយទៀត
បុគ្គលិកធនាគារ និងអ្នកប្រឹក្សាយោបល់
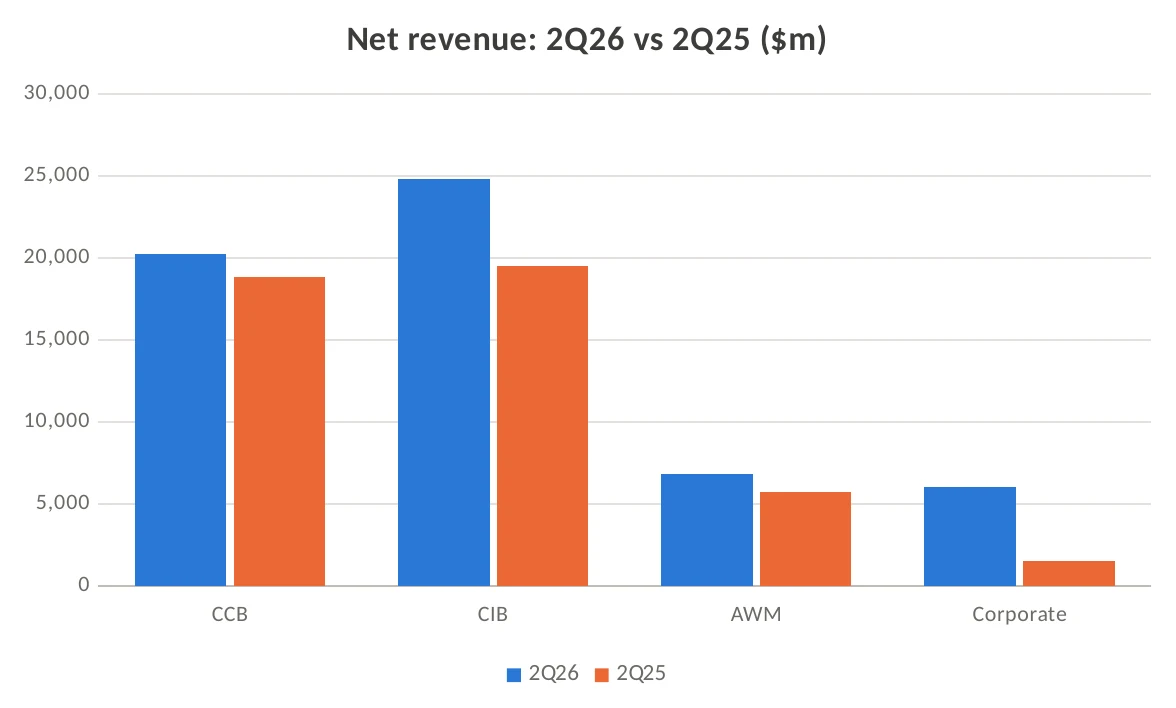
ឯកសារ PDF នៃសេចក្តីប្រកាសលទ្ធផលហិរញ្ញវត្ថុទៅជា Excel ជាមួយរូបមន្ត YoY និងគំនូសតាង
បុគ្គលិកធនាគារ និងអ្នកប្រឹក្សាយោបល់
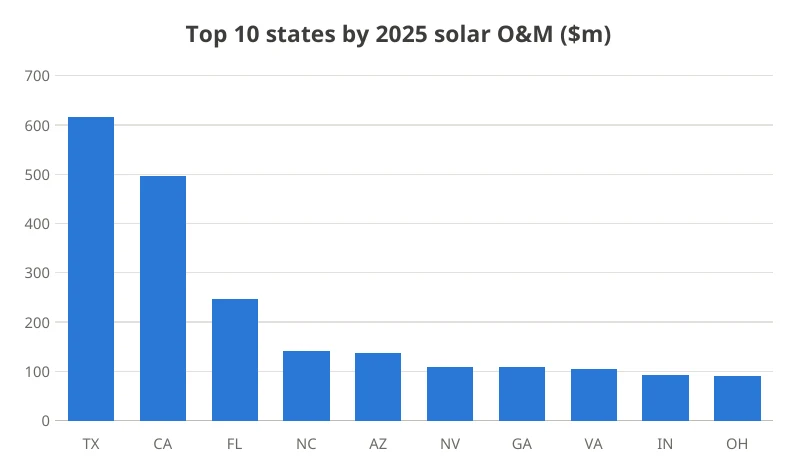
ប៉ាន់ប្រមាណទីផ្សារប្រតិបត្តិការ និងថែទាំថាមពលព្រះអាទិត្យអាមេរិកពីទិន្នន័យ EIA ក្នុងសៀវភៅបញ្ជីដដែល
បុគ្គលិកធនាគារ និងអ្នកប្រឹក្សាយោបល់