Please turn Chapter 1 of the attached World Bank Global Economic Prospects (June 2026) into a 6-slide PowerPoint for a client steering committee (our client is a mid-size manufacturer). Use only figures from the chapter.
1. Title slide
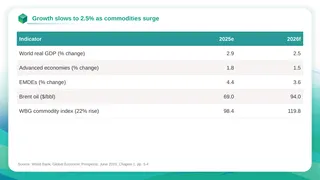
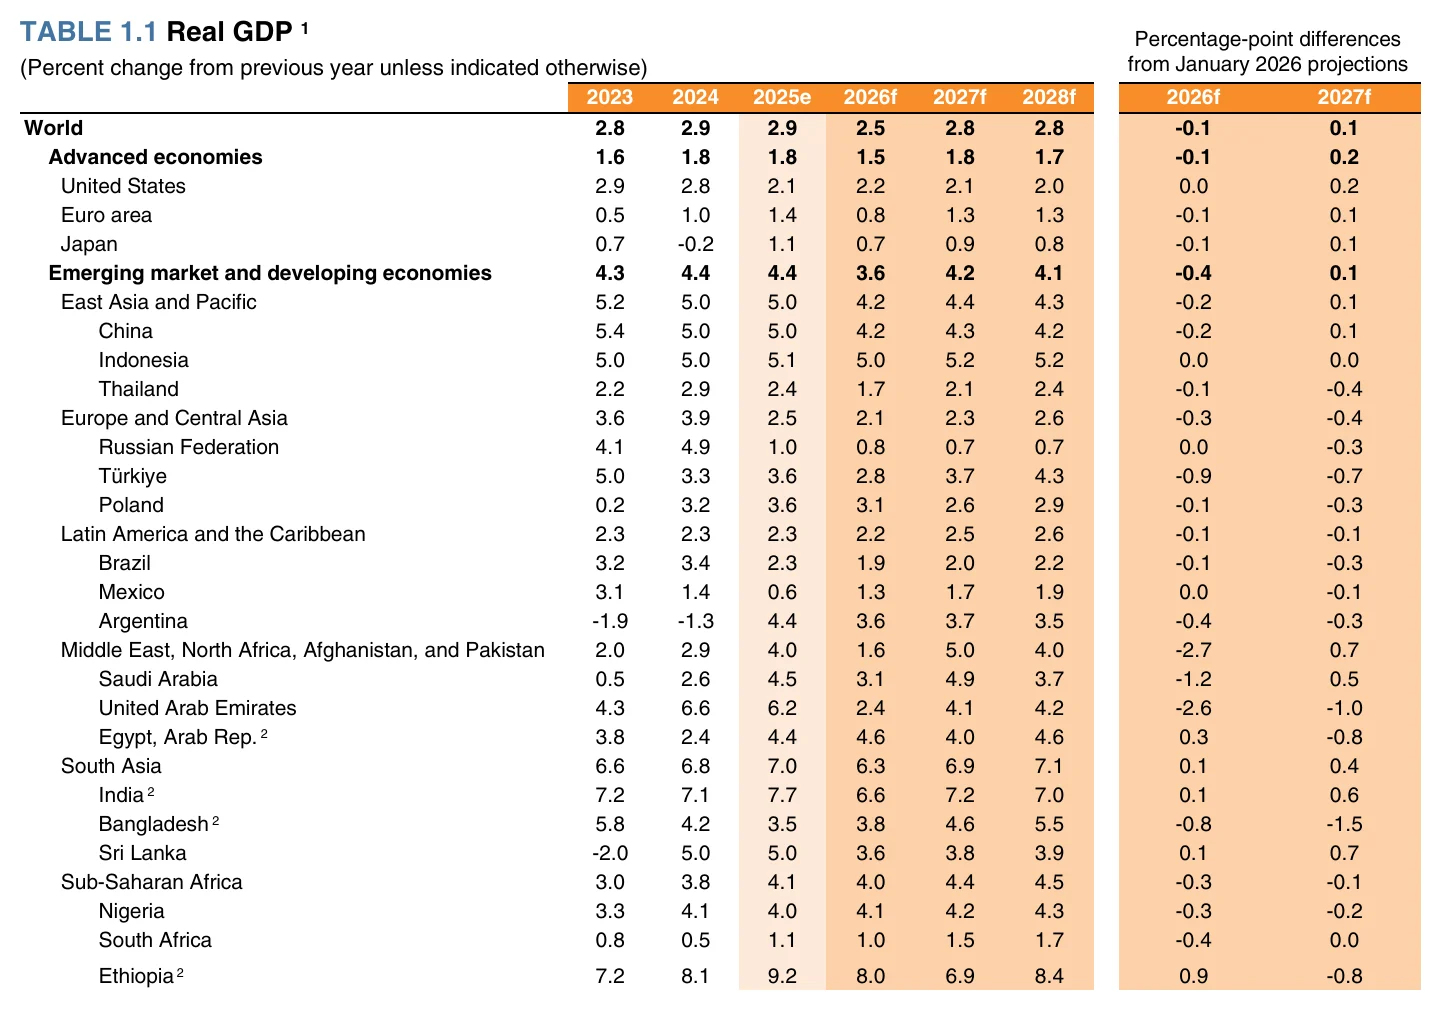
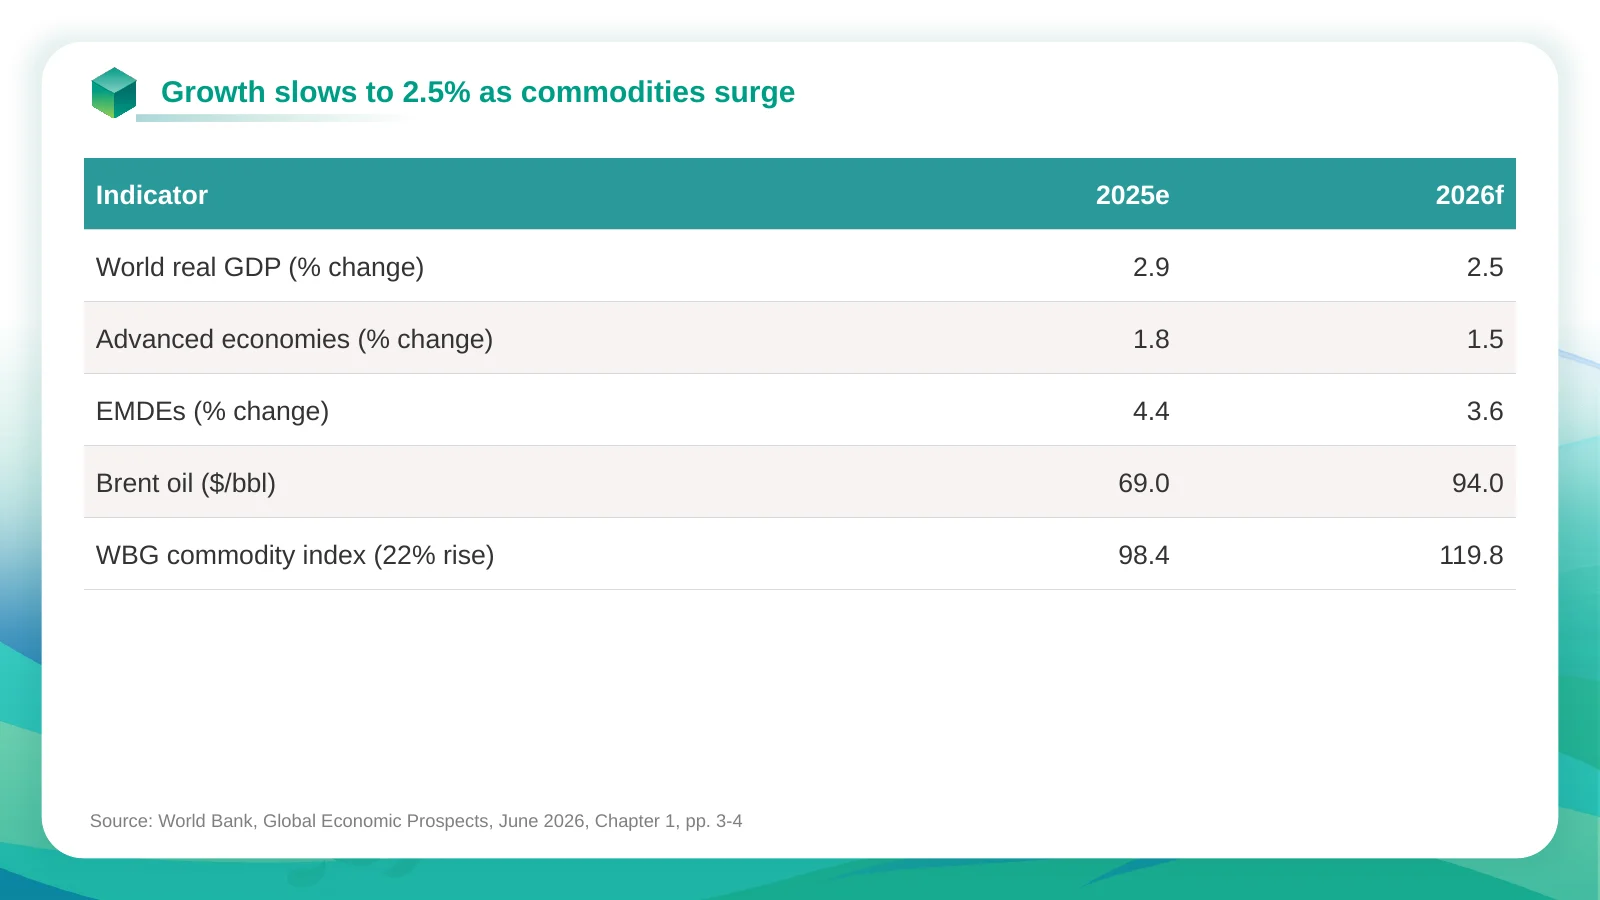
2. Headline numbers - world, advanced economies and EMDE growth 2025 vs 2026 (Table 1.1), plus the Brent oil and commodity price outlook from the Summary
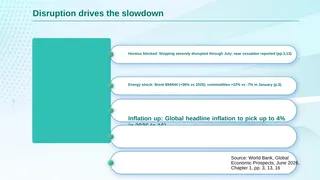
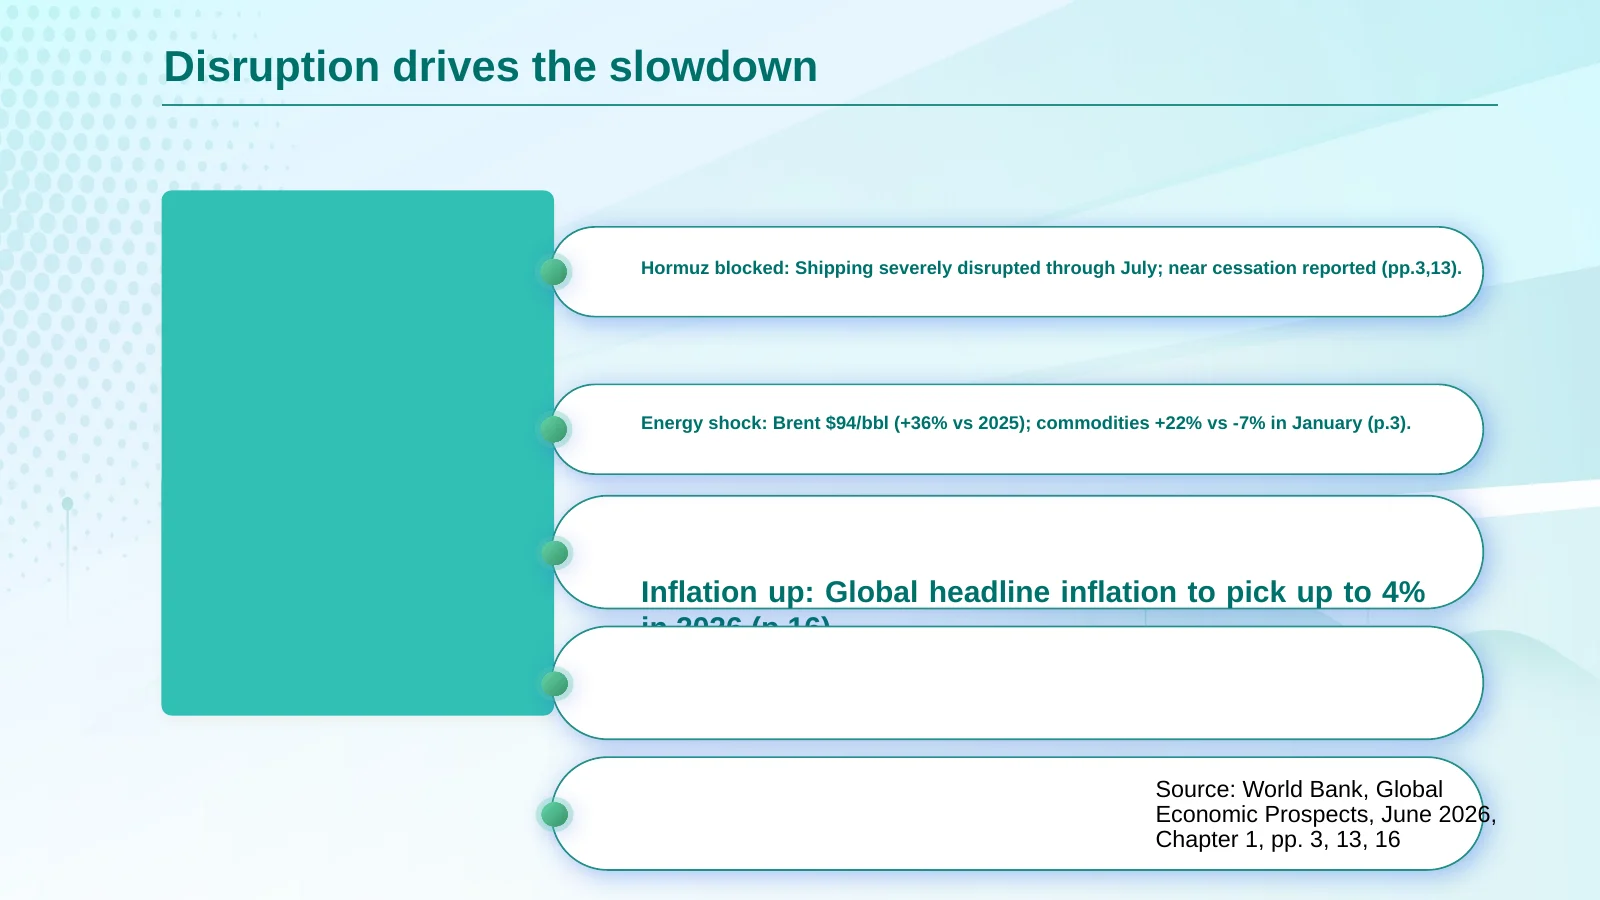
3. What's driving the slowdown - from the 'Global context' section (Strait of Hormuz disruption, energy prices, inflation and monetary conditions, trade)
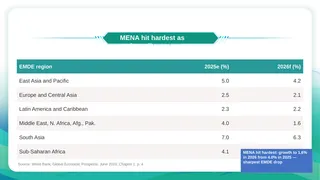
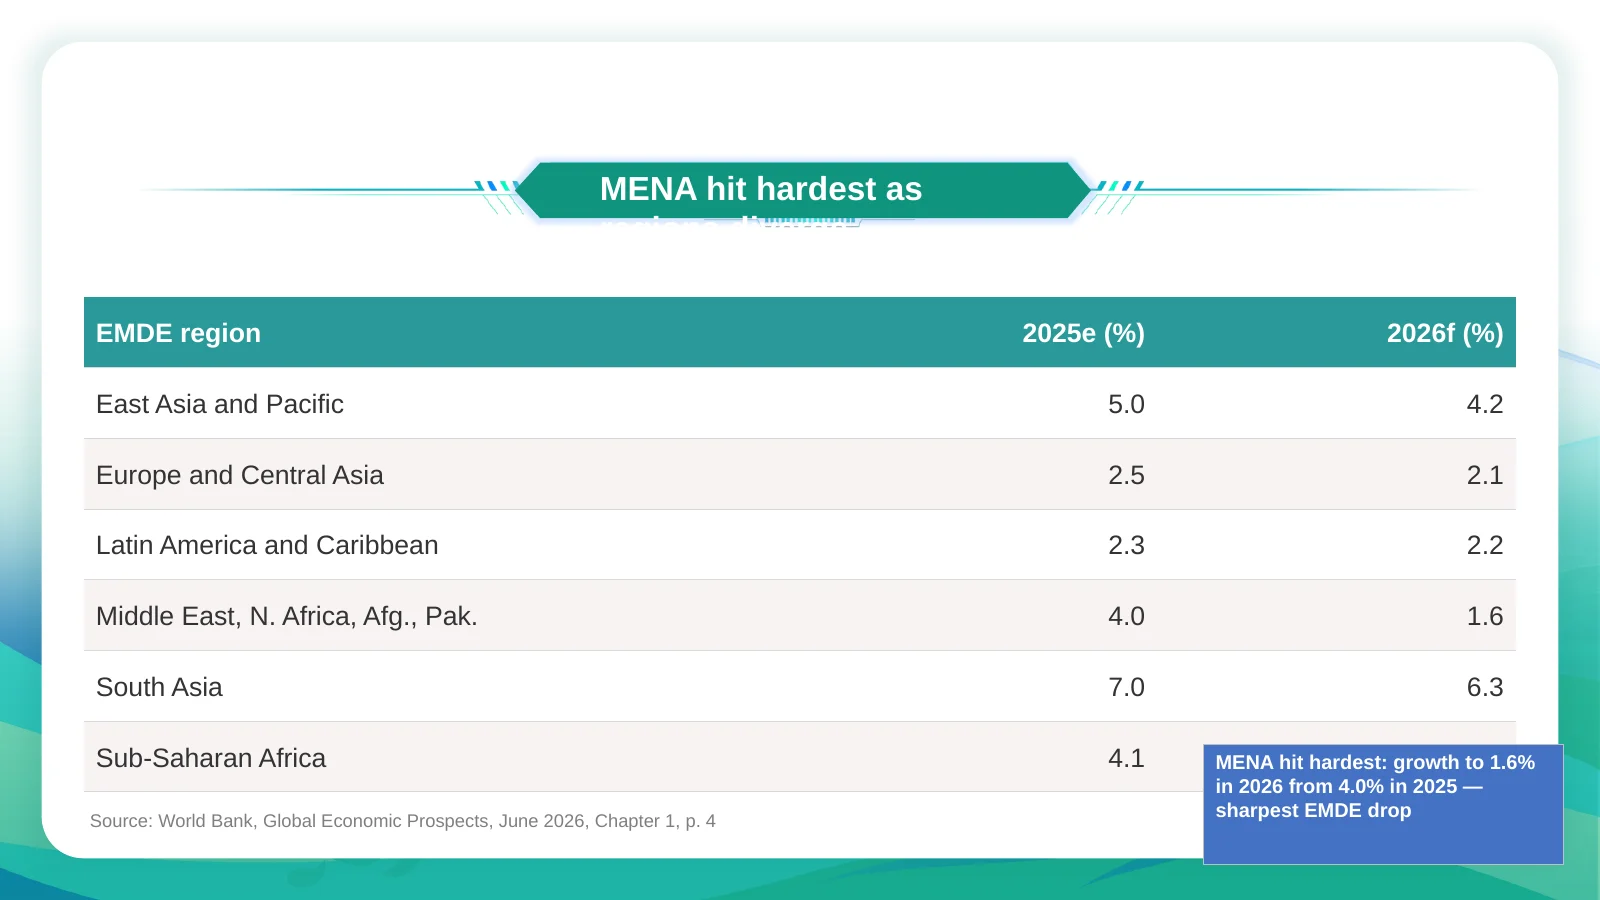
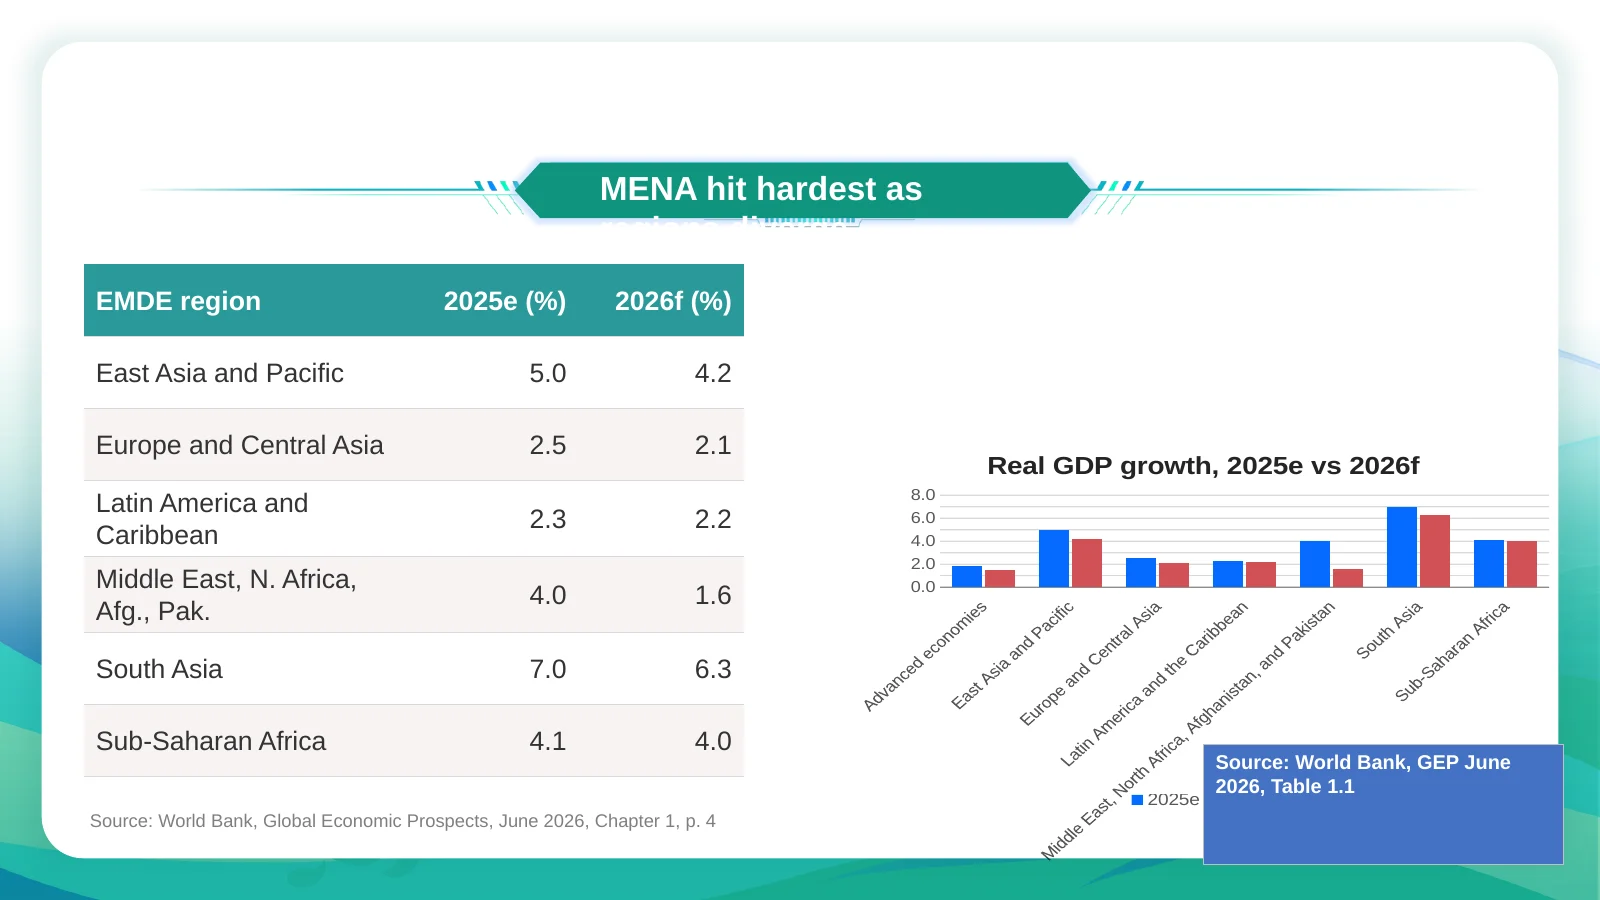
4. Regional picture - the six EMDE regions from Table 1.1, and which economies are hit hardest
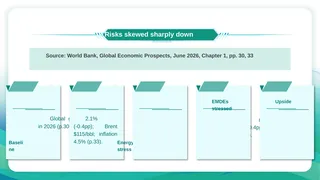
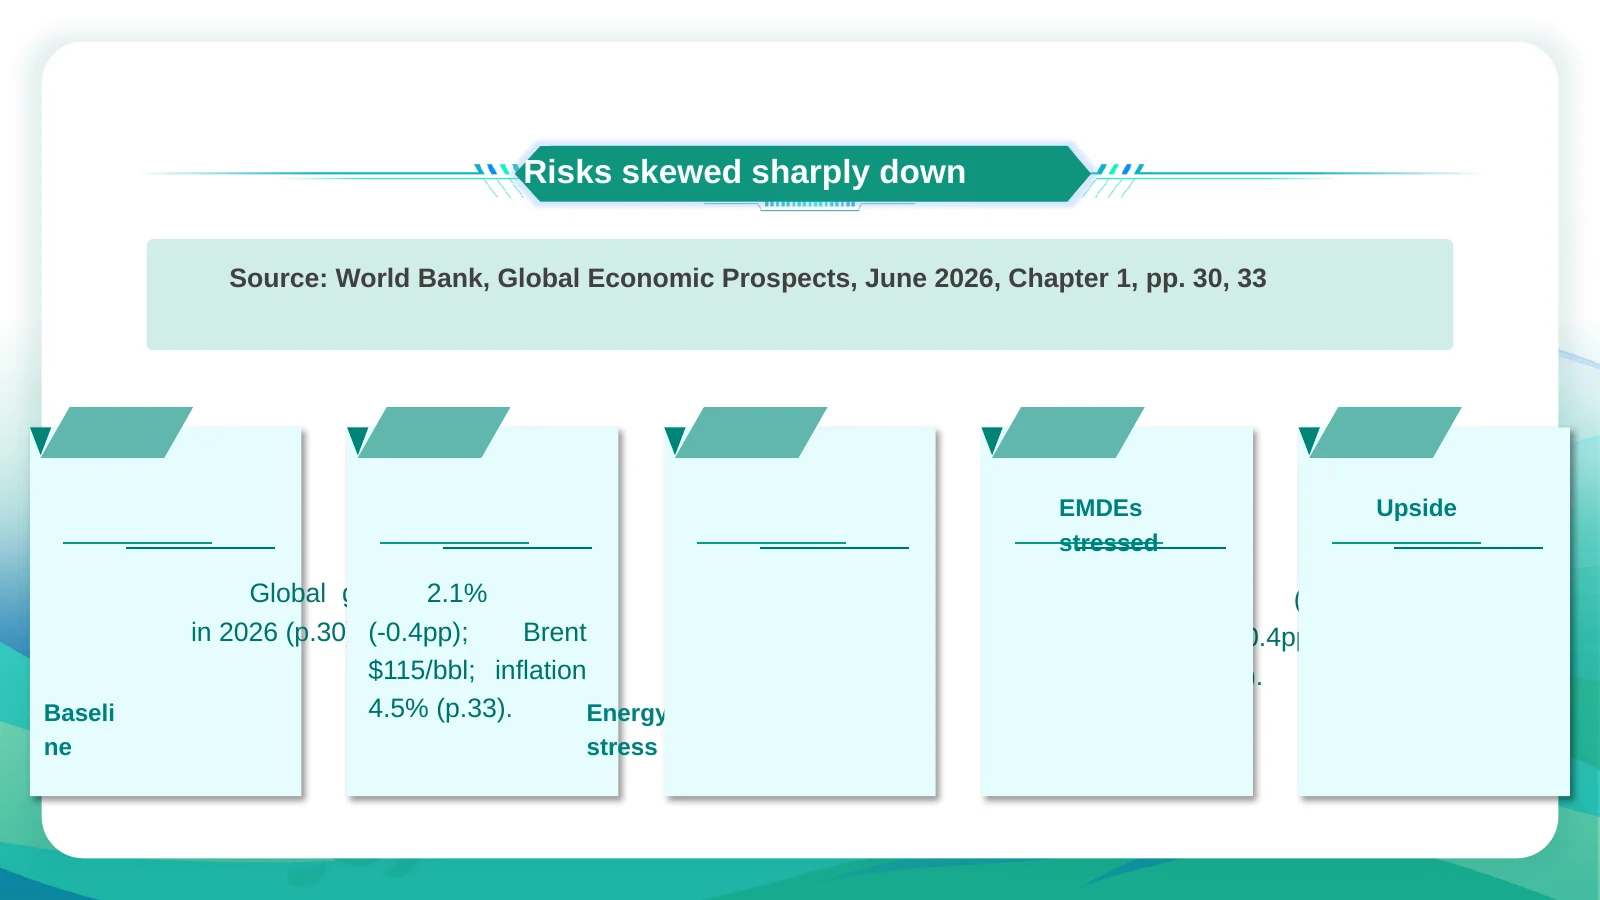
5. Risks - the downside scenarios in 'Risks to the outlook', with their growth numbers, and the upside risk
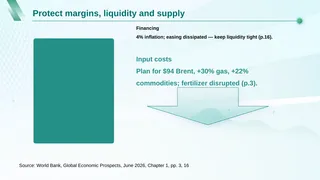
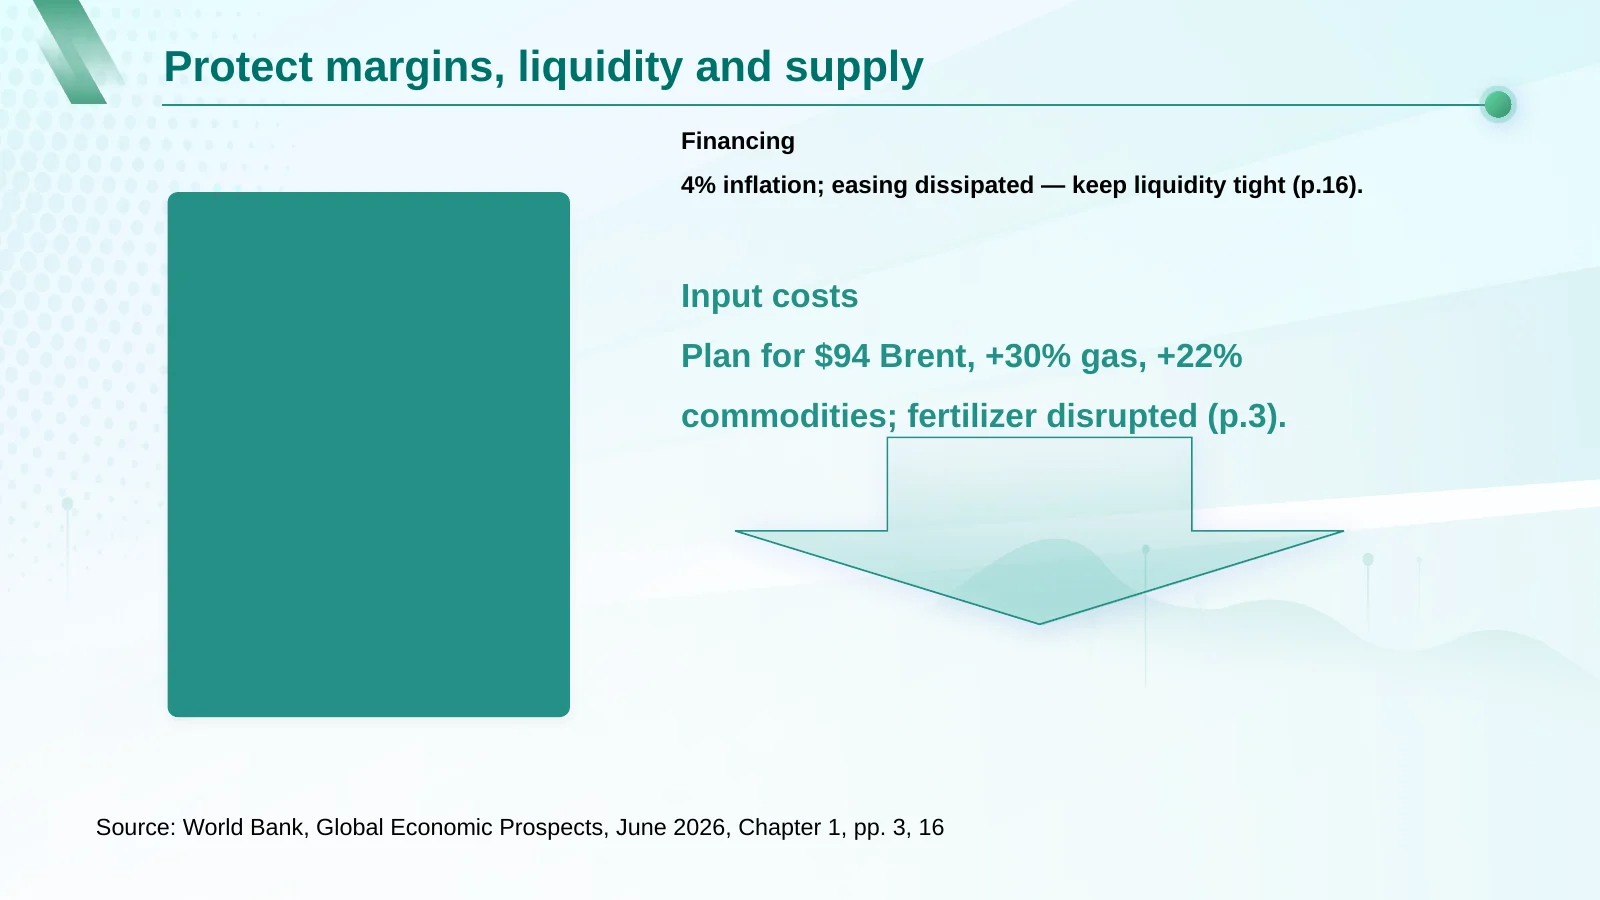
6. So what for a manufacturer - 3-4 points, each tied to a fact in the chapter (energy and input costs, financing conditions, trade, investment)
Max 5 bullets per slide. Footer on every slide: 'Source: World Bank, Global Economic Prospects, June 2026, Chapter 1' with the page number(s) used.
On slide 4, add a chart built from the attached Excel file (sheet 'Table 1.1'): a clustered bar chart of real GDP growth, 2025e vs 2026f, for Advanced economies and the six EMDE regions (East Asia and Pacific; Europe and Central Asia; Latin America and the Caribbean; Middle East, North Africa, Afghanistan, and Pakistan; South Asia; Sub-Saharan Africa).
- Use a real PowerPoint chart (editable data), not a picture
- Series named '2025e' and '2026f', values in percent with data labels
- Add 'Source: World Bank, GEP June 2026, Table 1.1' under the chart
- You may shorten the slide 4 bullets to make room; leave slides 1-3 and 5-6 untouched