דוגמה מעשית · EXCEL ו-POWERPOINT
טבלת תקציב של OMB לתרשים Excel ולמצגת תדרוך
אנליסט תקציב קיבל קובץ Excel של הוצאות ממשלת ארה"ב משנת 1940 ועד 2031. הוא ביקש מ- לחלץ ארבעה קווי הוצאה מרכזיים ולהציג אותם בתרשים עבור המנהל שלו.
ניתח את הנתונים על ידי יצירת טבלה של עלויות ביטחון, מדיקר, ביטחון סוציאלי וריבית לשנים 2015 עד 2031, וצייר תרשים באותו קובץ Excel. לאחר מכן התרשים הועבר לשקופית PowerPoint כתרשים אמיתי, לא כתמונה.
1קובץ האקסל המקורי, כפי שהועלה על ידי האנליסט
- 2בקשות באנגלית פשוטה
- 1קובץ Excel נערך, לא הוחלף
- 1מצגת שנבנתה ממנו
- 0נוסחאות שהוקלדו ידנית
פתח את הקבצים האמיתיים
אלו הקבצים בפועל מההרצה. הורד אותם ופתח אותם ב-Excel או ב-PowerPoint.
מאיפה מגיע הקובץ: OMB Historical Tables, טבלה 3.1, הוצאות לפי תחום-על ופונקציה, תקציב FY2027.
01 · קובץ ההתחלה
גיליון אלקטרוני ממשלתי גדול ומבולגן
הקובץ מפרט כל סוג של הוצאה פדרלית מ-1940 עד 2031, שנה אחת לכל עמודה. אלו 94 עמודות. יש בו כמה מלכודות: עמודת "TQ" נוספת שהוכנסה לאחר 1976, ושנים אחרי 2025 המסומנות כ-"הערכת 2026" וכן הלאה.
589,659| A | B | … | AL | AM | AN | … | BZ | CA | … | CI | CJ | CK | … | CP | |
|---|---|---|---|---|---|---|---|---|---|---|---|---|---|---|---|
| 1 | Table 3.1 - OUTLAYS BY SUPERFUNCTION AND FUNCTION: 1940 - 2031 | … | … | … | … | ||||||||||
| 2 | Superfunction and Function | 1940 | … | 1976 | TQ | 1977 | … | 2015 | 2016 | … | 2024 | 2025 | 2026 estimate | … | 2031 estimate |
| 3 | In millions of dollars: | … | … | … | … | ||||||||||
| 4 | National Defense | 1,660 | … | 89,619 | 22,269 | 97,241 | … | 589,659 | 593,372 | … | 873,523 | 916,140 | 966,396 | … | 1,369,123 |
| 5 | Human resources | 4,139 | … | 203,594 | 52,065 | 221,895 | … | 2,706,828 | 2,820,292 | … | 4,548,904 | 4,706,716 | 5,078,303 | … | 6,347,219 |
| 6 | Education, Training, Employment, and Social Services | 1,972 | … | 18,910 | 5,169 | 21,104 | … | 122,035 | 109,709 | … | 306,370 | 72,042 | 101,970 | … | 133,413 |
| 7 | Health | 55 | … | 15,734 | 3,924 | 17,302 | … | 482,257 | 511,325 | … | 911,290 | 978,511 | 1,047,526 | … | 1,143,249 |
| 8 | Medicare | .......... | … | 15,834 | 4,264 | 19,345 | … | 546,202 | 594,536 | … | 874,133 | 996,718 | 1,070,248 | … | 1,573,538 |
| 9 | Income Security | 1,514 | … | 60,784 | 14,981 | 61,045 | … | 508,800 | 514,098 | … | 670,548 | 701,609 | 741,971 | … | 743,752 |
| 10 | Social Security | 28 | … | 73,899 | 19,763 | 85,061 | … | 887,753 | 916,067 | … | 1,460,918 | 1,580,673 | 1,676,441 | … | 2,151,475 |
| … | |||||||||||||||
| 22 | Net interest | 899 | … | 26,727 | 6,949 | 29,901 | … | 223,181 | 240,033 | … | 879,879 | 970,065 | 1,016,650 | … | 1,363,769 |
| … | |||||||||||||||
| 35 | Total, Federal outlays | 9,468 | … | 371,792 | 95,975 | 409,218 | … | 3,691,850 | 3,852,615 | … | 6,735,261 | 7,011,105 | 7,540,434 | … | 9,279,779 |
| … | |||||||||||||||
| 39 | National defense | 17.5 | … | 24.1 | 23.2 | 23.8 | … | 16.0 | 15.4 | … | 13.0 | 13.1 | 12.8 | … | 14.8 |
| 42 | Net interest | 9.5 | … | 7.2 | 7.2 | 7.3 | … | 6.0 | 6.2 | … | 13.1 | 13.8 | 13.5 | … | 14.7 |
02 · בקשה 1
הוסף טבלת סיכום ותרשים
מה שהאנליסט הקליד
In the attached OMB Historical Table 3.1 (FY2027 Budget), please add a new sheet called 'Big Four' and leave the 'Table' sheet exactly as it is. On the new sheet:
1. Column A: fiscal years 2015 to 2031, one row per year (17 rows).
2. Columns B-E: National Defense (row 4), Medicare (row 8), Social Security (row 10) and Net interest (row 22) from the Table sheet, converted from $ millions to $ billions, one decimal. Use formulas that point at the Table sheet if you can.
3. Column F: 'Actual' for 2015-2025 and 'Estimate' for 2026-2031 (the columns headed '2026 estimate' to '2031 estimate').
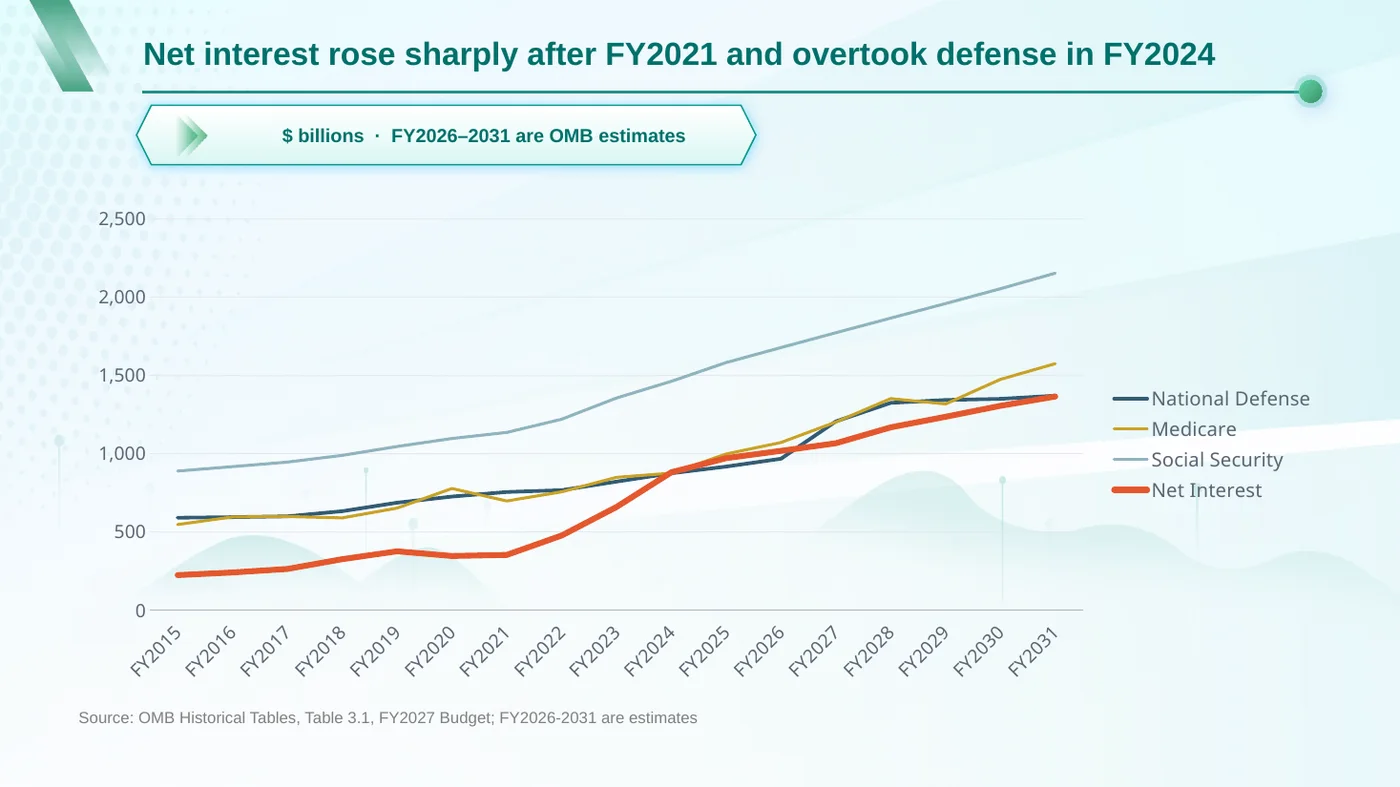
4. A native Excel line chart of the four series with years on the x-axis, titled 'Federal outlays by function, FY2015-FY2031 ($ billions)', with a note that 2026-2031 are OMB estimates.
מה ש- עשה
- עבד בתוך קובץ ה-Excel שהועלה. הוא לא יצר קובץ חדש.
- בדק את תוויות השנים תחילה, כך ששנת 2015 מתיישרת עם העמודה הנכונה למרות עמודת ה-TQ הנוספת.
- הוסיף גיליון חדש, "Big Four": שורה אחת לכל שנה מ-2015 ועד 2031, ארבעה קווי הוצאה במיליארדים, ותוית "בפועל" או "הערכה".
- מילא אותו בנוסחאות המפנות בחזרה לגיליון המקורי, כך שניתן לעקוב אחר כל מספר. לחץ על תא ירוק למטה כדי לראות אחד.
- צייר תרשים קווים אמיתי ב-Excel עליו ניתן ללחוץ ולערוך.
- גיליון המקור לא שונה. בדקנו כל תא.
=ROUND(Table!BZ4/1000,1)| A | B | C | D | E | F | |
|---|---|---|---|---|---|---|
| 1 | Fiscal Year | National Defense ($ billions) | Medicare ($ billions) | Social Security ($ billions) | Net Interest ($ billions) | Type |
| 2 | 2015 | 589.7 | 546.2 | 887.8 | 223.2 | Actual |
| 3 | 2016 | 593.4 | 594.5 | 916.1 | 240 | Actual |
| 4 | 2017 | 598.7 | 597.3 | 944.9 | 262.6 | Actual |
| 5 | 2018 | 631.3 | 588.7 | 987.8 | 325 | Actual |
| 6 | 2019 | 685.7 | 651 | 1044.4 | 375.2 | Actual |
| 7 | 2020 | 724.6 | 776.2 | 1095.8 | 345.5 | Actual |
| 8 | 2021 | 753.9 | 696.5 | 1134.6 | 352.3 | Actual |
| 9 | 2022 | 765.6 | 755.1 | 1218.7 | 475.9 | Actual |
| 10 | 2023 | 820.3 | 847.5 | 1354.3 | 658.3 | Actual |
| 11 | 2024 | 873.5 | 874.1 | 1460.9 | 879.9 | Actual |
| 12 | 2025 | 916.1 | 996.7 | 1580.7 | 970.1 | Actual |
| 13 | 2026 | 966.4 | 1070.2 | 1676.4 | 1016.7 | Estimate |
| 14 | 2027 | 1205 | 1200.8 | 1771.1 | 1065.4 | Estimate |
| 15 | 2028 | 1323.2 | 1350.5 | 1864.4 | 1167 | Estimate |
| 16 | 2029 | 1341.6 | 1316.2 | 1957.3 | 1234.6 | Estimate |
| 17 | 2030 | 1348.8 | 1473.4 | 2052.1 | 1304.5 | Estimate |
| 18 | 2031 | 1369.1 | 1573.5 | 2151.5 | 1363.8 | Estimate |
| 20 | Note: 2026-2031 are OMB estimates. | |||||
Federal outlays by function, FY2015-FY2031 ($ billions)
- National Defense ($ billions)
- Medicare ($ billions)
- Social Security ($ billions)
- Net Interest ($ billions)
בינה מלאכותית בדקה את המספרים פעמיים: ההוצאה על ביטחון ב-2015 עמדה על 589.7, מדיקר על 546.2, ביטחון סוציאלי על 887.8 ותשלומי ריבית על 223.2 (מיליארדים), וכולם תואמים לנתוני הממשלה.
03 · בקשה 2
כעת הפוך זאת לשלושה שקופיות
מה שהאנליסט הקליד
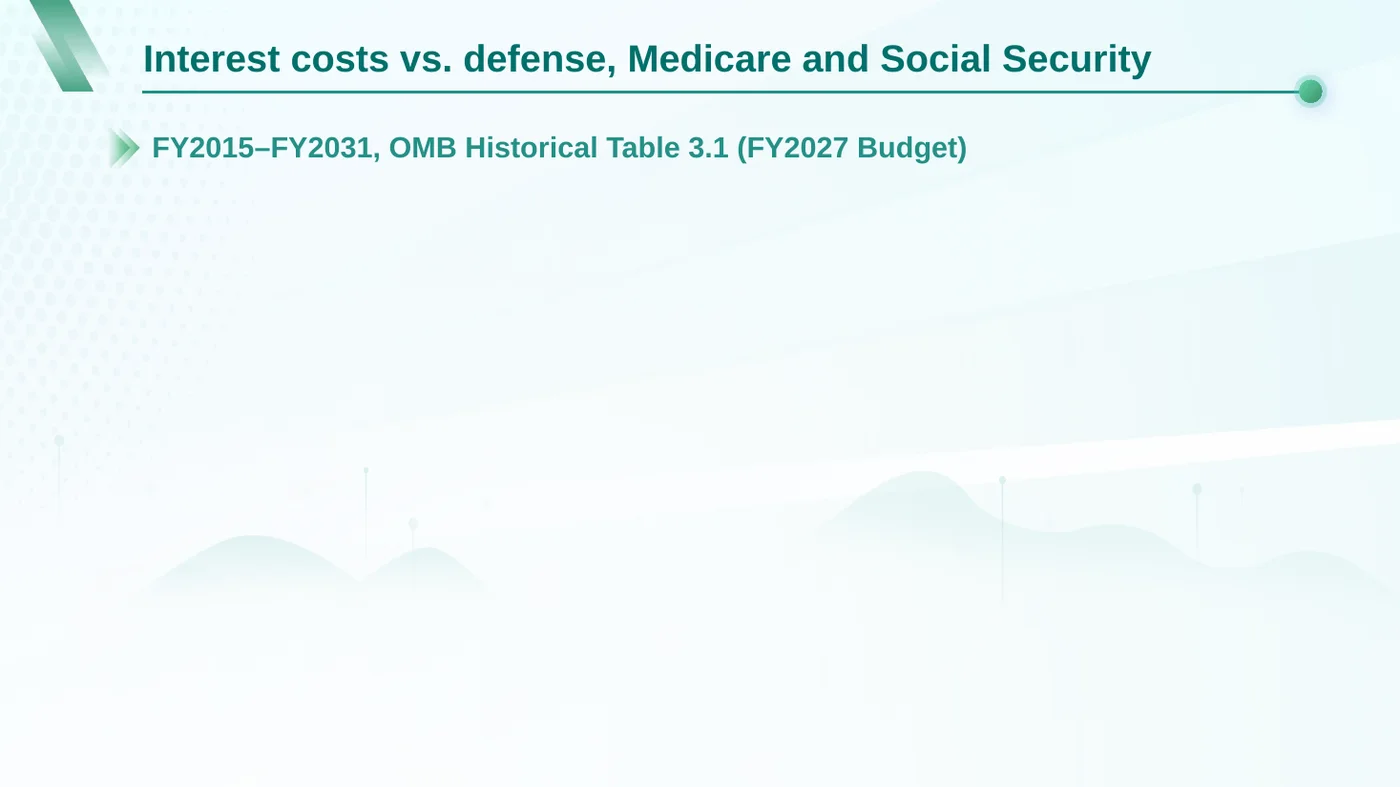
Now build a 3-slide PowerPoint for the Deputy Secretary from the 'Big Four' sheet:
1. Title slide: 'Interest costs vs. defense, Medicare and Social Security', subtitle 'FY2015-FY2031, OMB Historical Table 3.1 (FY2027 Budget)'.
2. The line chart, with a one-line headline stating what it shows, and 'Source: OMB Historical Tables, Table 3.1, FY2027 Budget; FY2026-2031 are estimates' at the bottom.
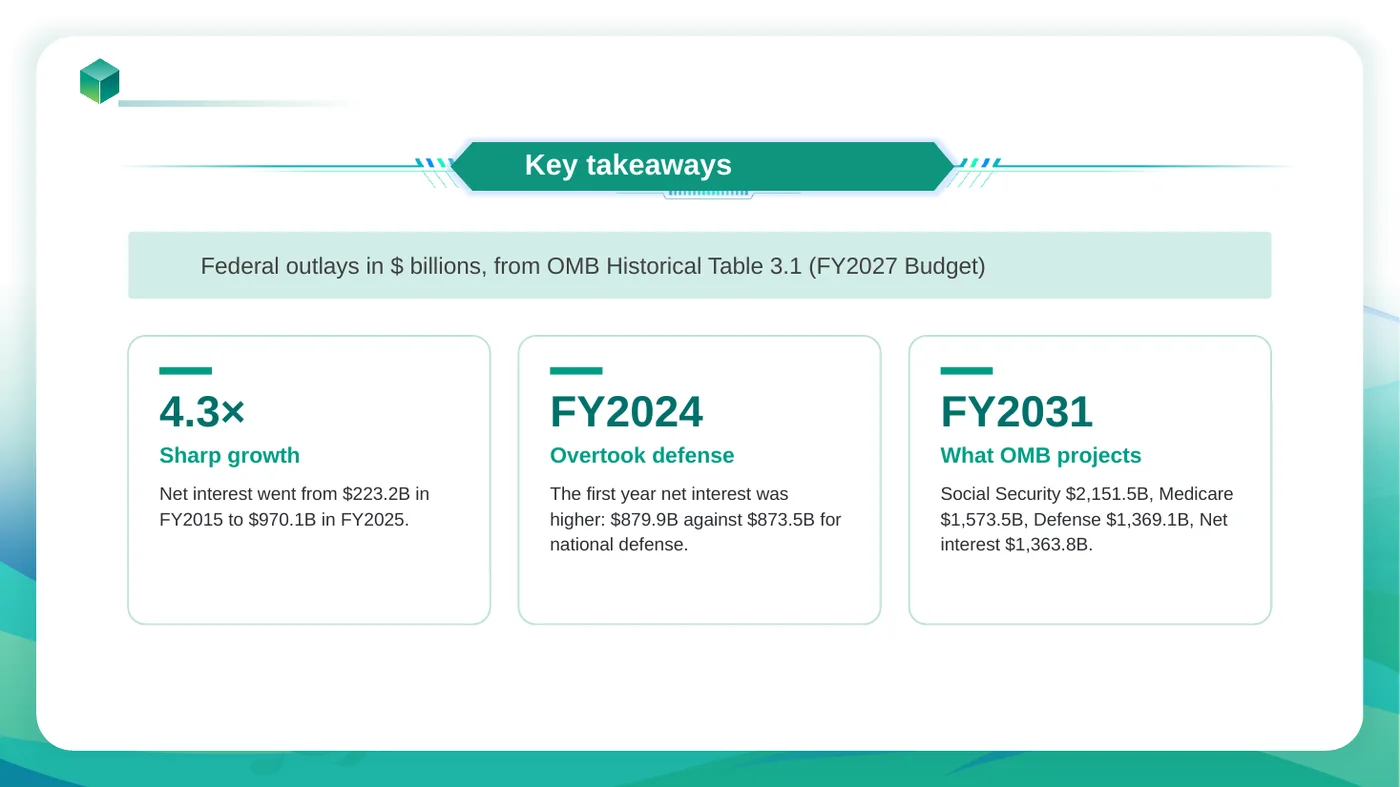
3. Three takeaways, each with figures from the sheet: (a) how net interest grew from FY2015 to FY2025; (b) the first fiscal year in which net interest exceeded national defense, with both amounts; (c) what OMB projects for the four lines in FY2031.

Plain government style, no stock images.
מה ש- עשה
- קרא את גיליון "Big Four" שזה עתה יצר, כך שהשקופיות והגיליון האלקטרוני מציגים את אותם המספרים.
- אפשר לאנליסט לבחור עיצוב מספריית התבניות שלו.
- הציב את התרשים בשקופית 2 כתרשים PowerPoint אמיתי, עם הנתונים בתוכו. לחץ עליו קליק ימני ובחר ״עריכת נתונים״.
- כתב את הנקודות המרכזיות מתוך המספרים: עלויות הריבית צמחו פי 4.3 מ-2015 ל-2025, ועקפו את הוצאות הביטחון לראשונה ב-2024.
הקבצים שלך, נערכים במקום שבו הם נמצאים
רוב כלי הבינה המלאכותית קוראים את הגיליון האלקטרוני שלך ומחזירים חדש. פותח את הקובץ שהעלית, משנה רק את מה שביקשת ושומר כל גרסה קודמת.
המשיכו לקרוא