Turn a World Bank outlook chapter into a client steering deck
A consultant with a steering committee coming up uploaded Chapter 1 of the World Bank’s June 2026 Global Economic Prospects, 46 pages, and asked for six slides for a mid-size manufacturer, using only the chapter’s figures. found the numbers, built the deck with the page of every figure in the footer, and then added a real PowerPoint chart to slide 4 from the World Bank’s own Excel table, in the same deck.
1Reads the World Bank chapter, 46 pages
GEP-Jun-2026-Chapter-1.pdf
4CHAPTER 1
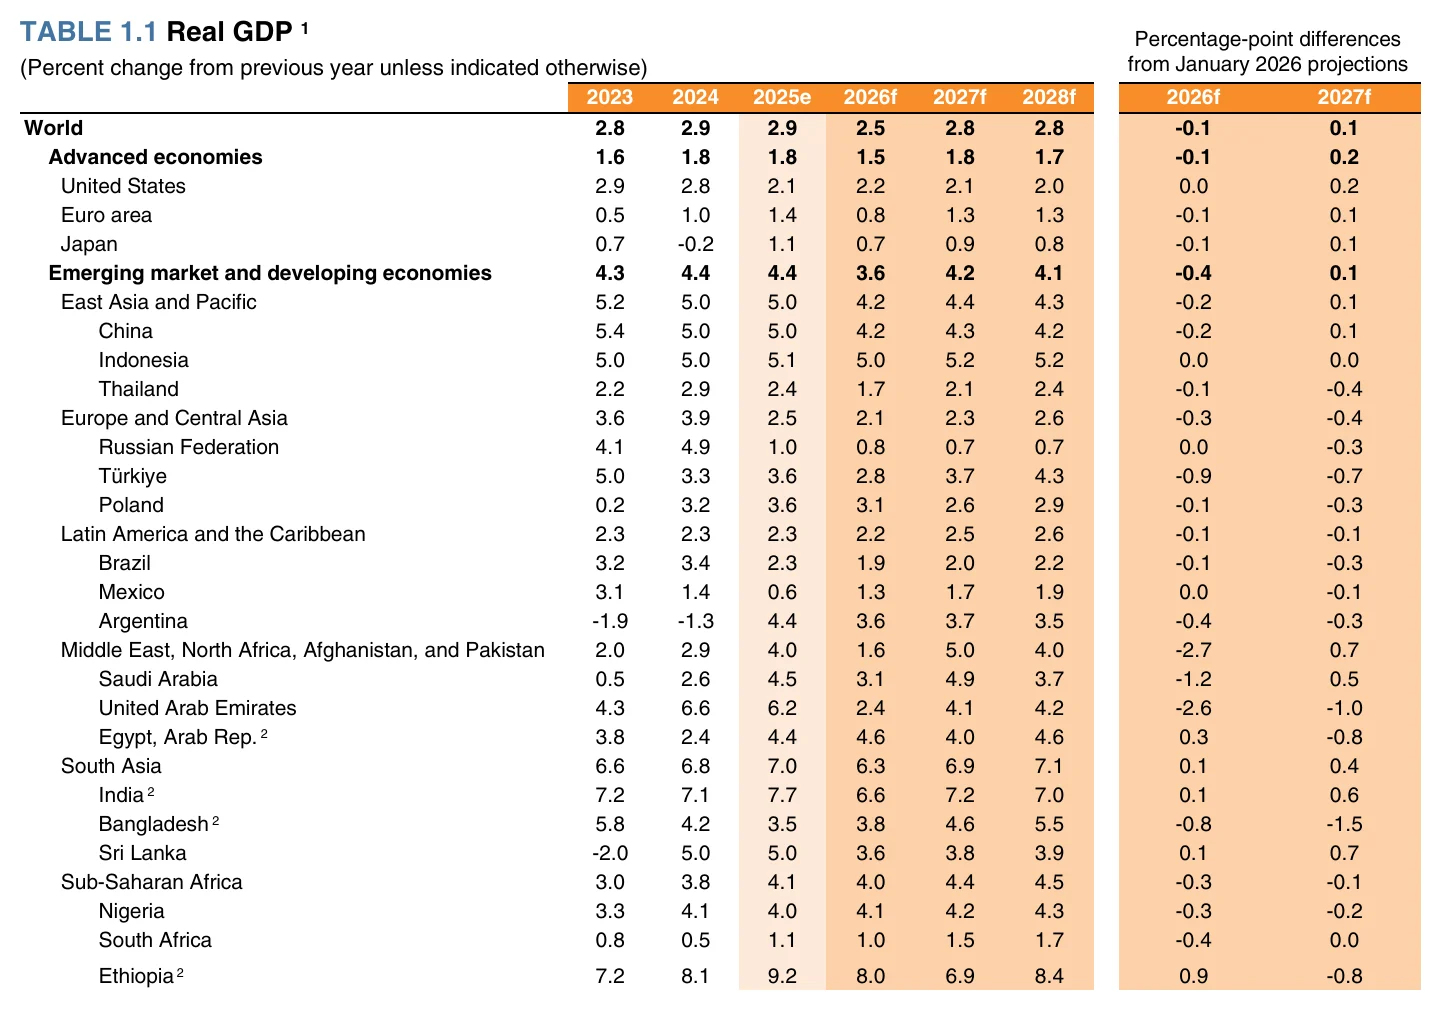
TABLE 1.1 Real GDP
2025e2026f
World2.92.5
Advanced economies1.81.5
Emerging market and developing economies4.43.6
Oil (US$ per barrel)69.094.0
46 pages
GEP Jun 2026 Ch1 Steering Committee.pptx
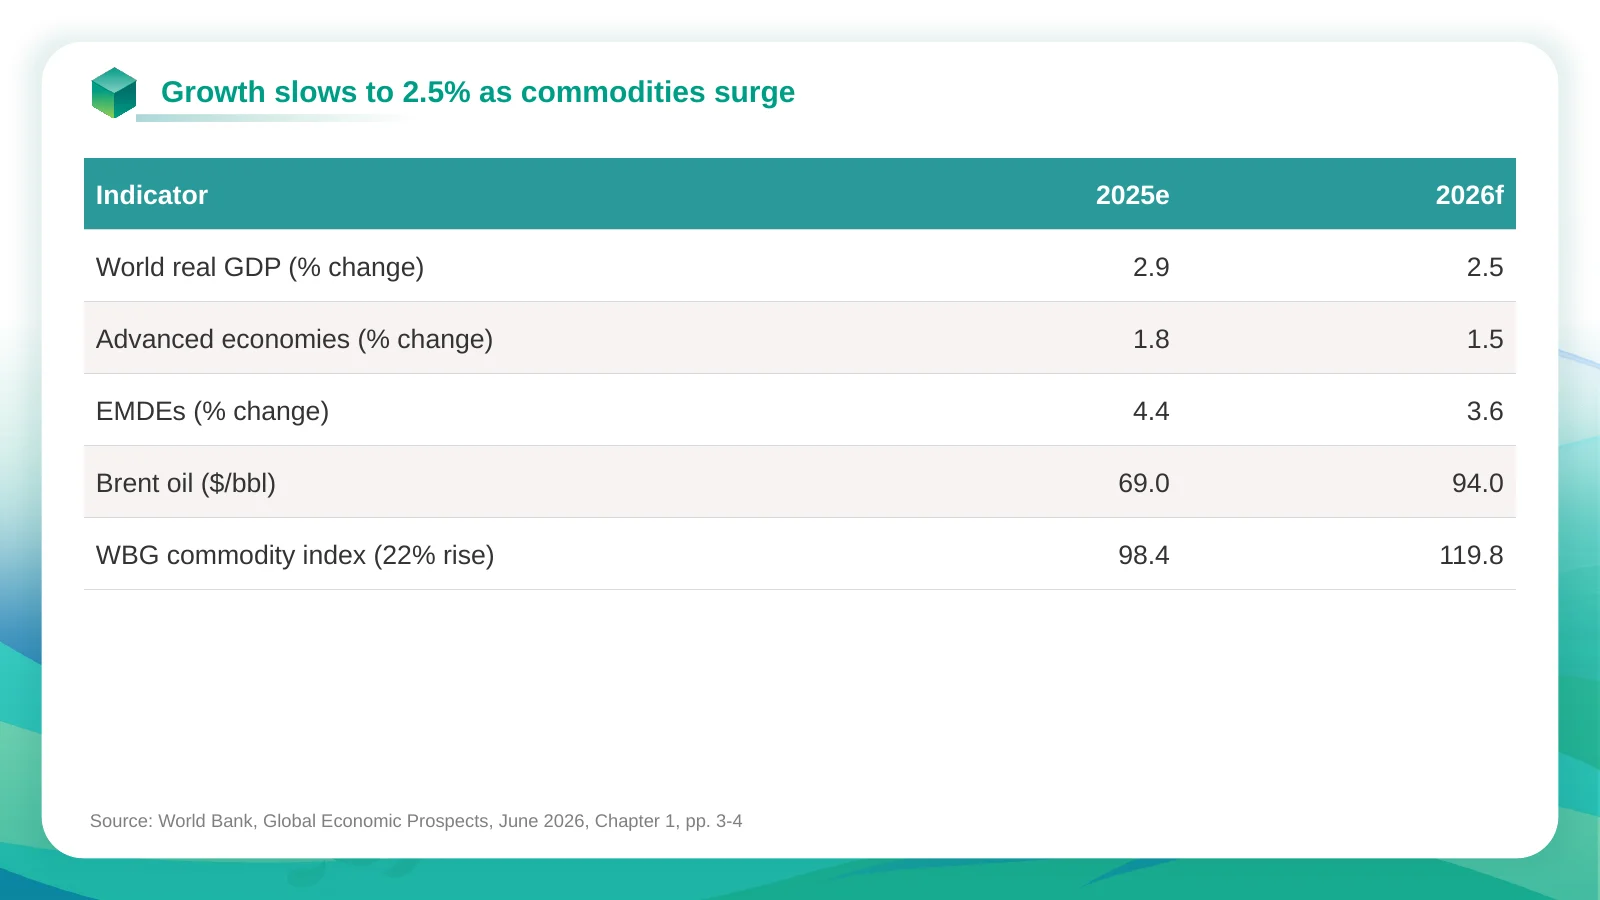
Growth slows to 2.5% as commodities surge
Indicator2025e2026f
World real GDP (% change)2.92.5
Advanced economies (% change)1.81.5
EMDEs (% change)4.43.6
Brent oil ($/bbl)69.094.0
WBG commodity index (22% rise)98.4119.8
Source: World Bank, Global Economic Prospects, June 2026, Chapter 1, pp. 3-4
GEP-Jun-2026-Table-1-1.xlsx
HI
Table 1.12025e2026f
Advanced economies1.81.5
East Asia and Pacific5.04.2
Europe and Central Asia2.52.1
Latin America and the Caribbean2.32.2
Middle East, North Africa, Afghanistan, and Pakistan4.01.6
South Asia7.06.3
Sub-Saharan Africa4.14.0
Table 1.1
Every figure from the chapter, with its pageGrowth, oil and risk numbers pulled from 46 pages onto six slides, each footer naming the pages it used. Nothing from memory.
A real chart, not a pictureSlide 4’s chart holds its own data: 14 values from the World Bank’s Excel file. Right-click it in PowerPoint and choose Edit Data.
One deck you keep working onRequest 2 opened the deck from request 1 and changed slide 4 only. The other five slides are untouched, checked word for word.
01 · REQUEST 1
read the chapter and built the six slides
The consultant
Please turn Chapter 1 of the attached World Bank Global Economic Prospects (June 2026) into a 6-slide PowerPoint for a client steering committee (our client is a mid-size manufacturer). Use only figures from the chapter.
1. Title slide
2. Headline numbers - world, advanced economies and EMDE growth 2025 vs 2026 (Table 1.1), plus the Brent oil and commodity price outlook from the Summary
3. What's driving the slowdown - from the 'Global context' section (Strait of Hormuz disruption, energy prices, inflation and monetary conditions, trade)
4. Regional picture - the six EMDE regions from Table 1.1, and which economies are hit hardest
5. Risks - the downside scenarios in 'Risks to the outlook', with their growth numbers, and the upside risk
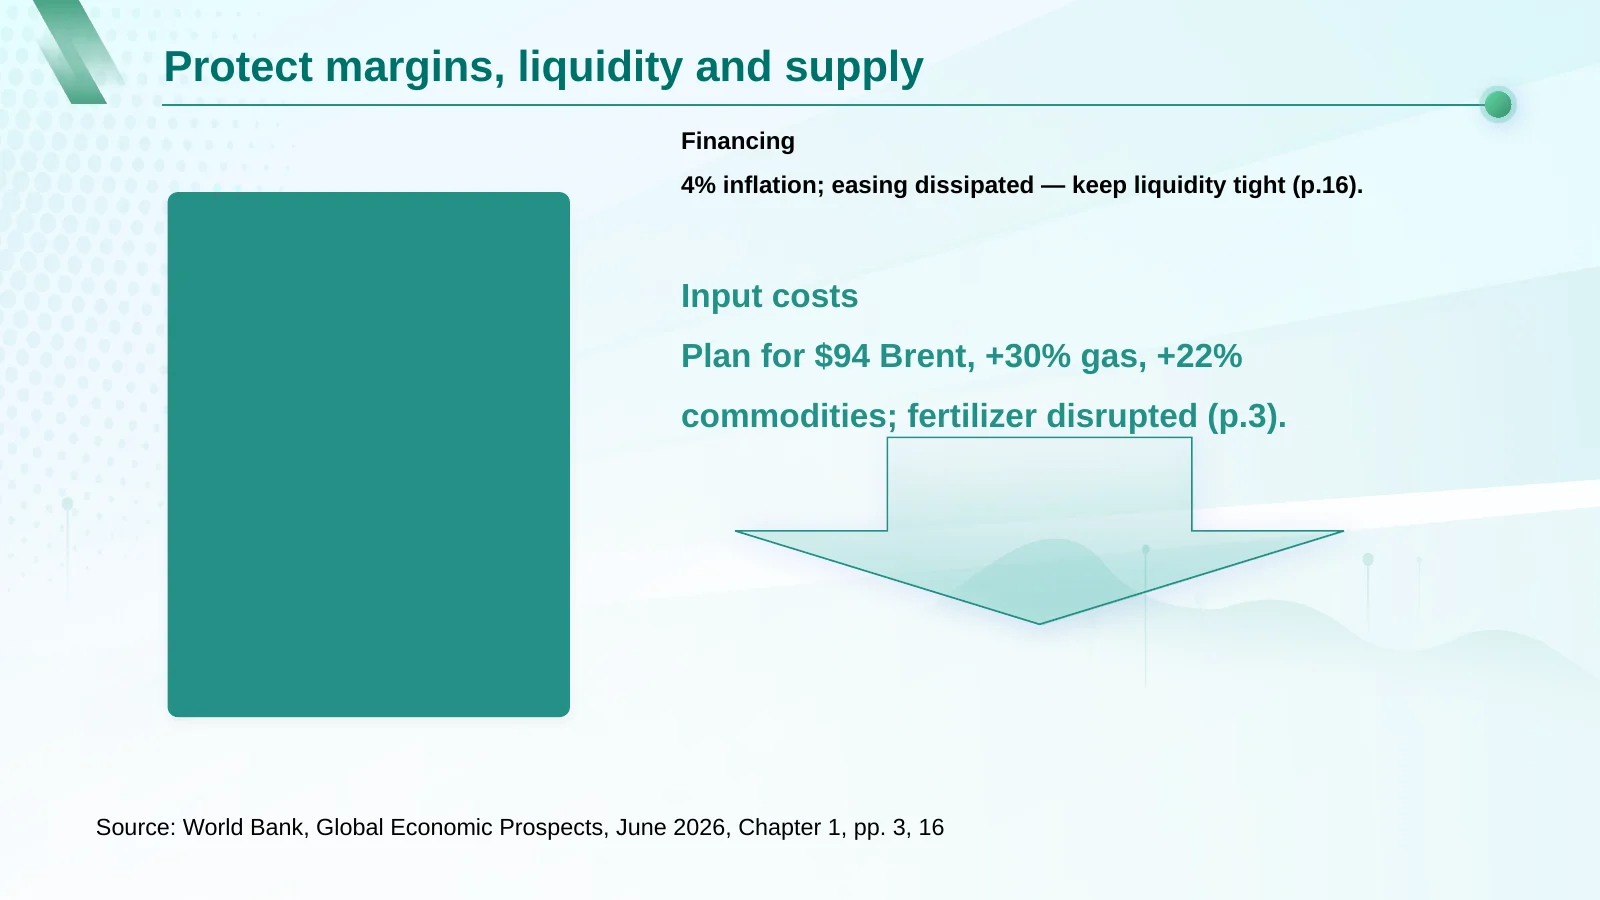
6. So what for a manufacturer - 3-4 points, each tied to a fact in the chapter (energy and input costs, financing conditions, trade, investment)
Max 5 bullets per slide. Footer on every slide: 'Source: World Bank, Global Economic Prospects, June 2026, Chapter 1' with the page number(s) used.
Found the numbers across 46 pages
The growth forecasts are in Table 1.1 on page 4. Oil and commodity prices are in the Summary on page 3, the causes of the slowdown on pages 13 to 16, the risk scenarios on pages 30 to 33. Each slide needed a page reference, so every figure was traced to where it sits.
Table 1.1 · p. 4growth by region
Summary · p. 3oil and commodities
Global context · pp. 13–16what drives the slowdown
Risks · pp. 30–33the scenarios
Image from the source documentPage 4: Table 1.1. Each region sits above its own country rows, which a summary has to skip.Open the original
Wrote the headline slide from Table 1.1 and the Summary
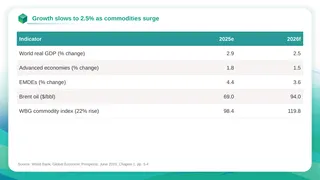
Slide 2 holds world, advanced-economy and developing-economy growth for 2025 and 2026, Brent oil and the commodity index, as a table. Its footer cites pages 3 and 4.
Picture of the delivered fileSlide 2 as delivered: world growth 2.9% to 2.5%, Brent oil $69 to $94 a barrel.
Named the region hit hardest
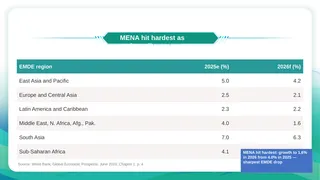
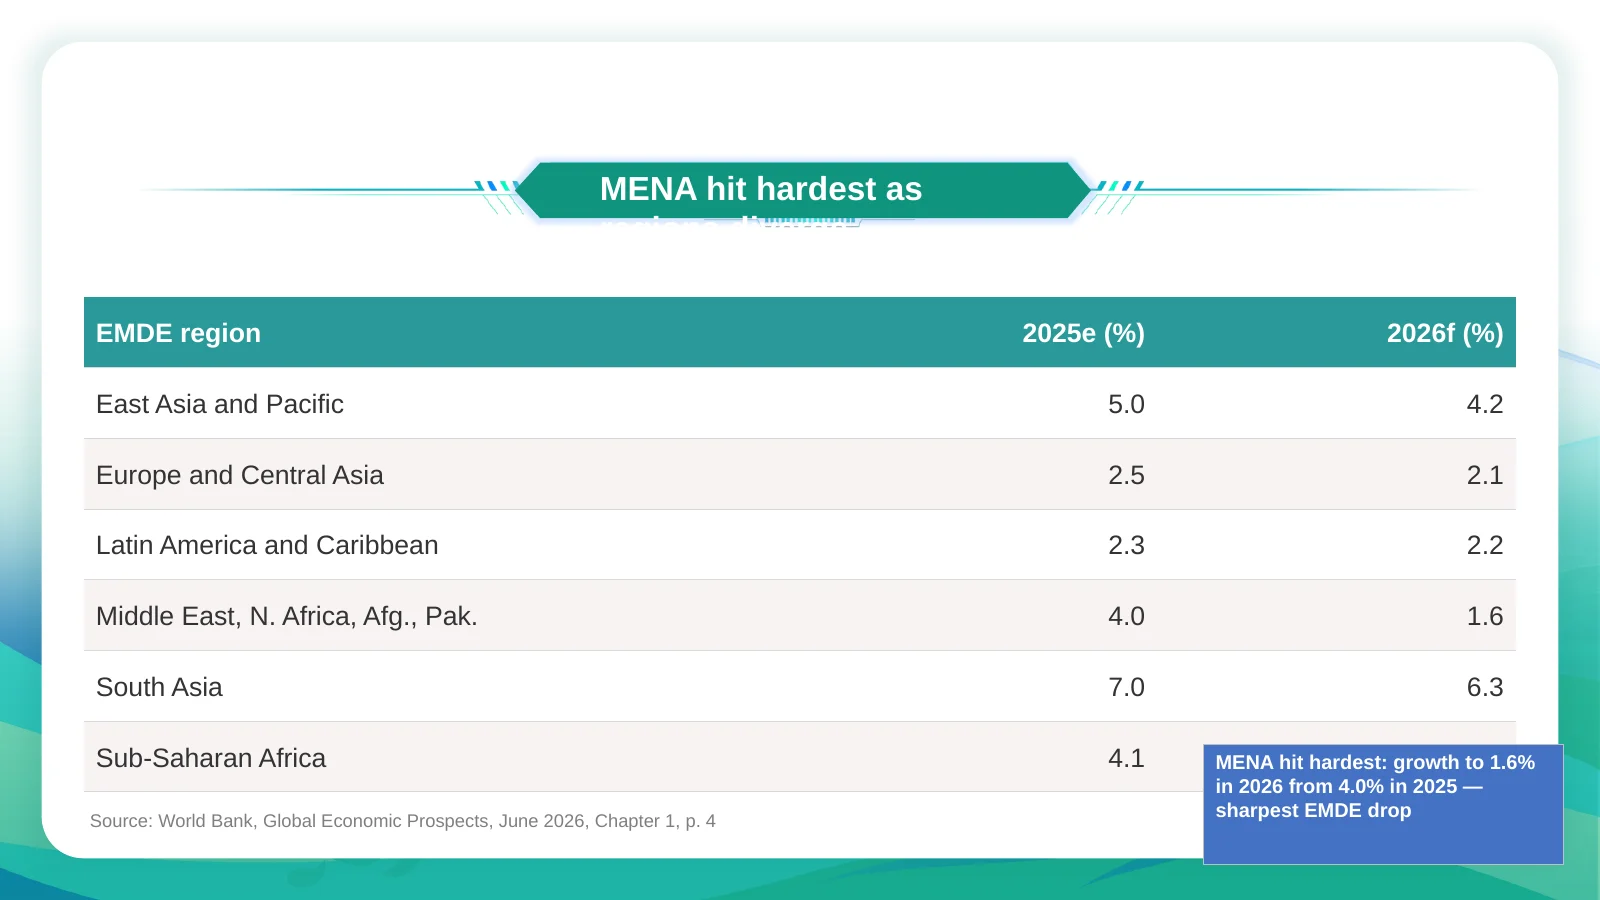
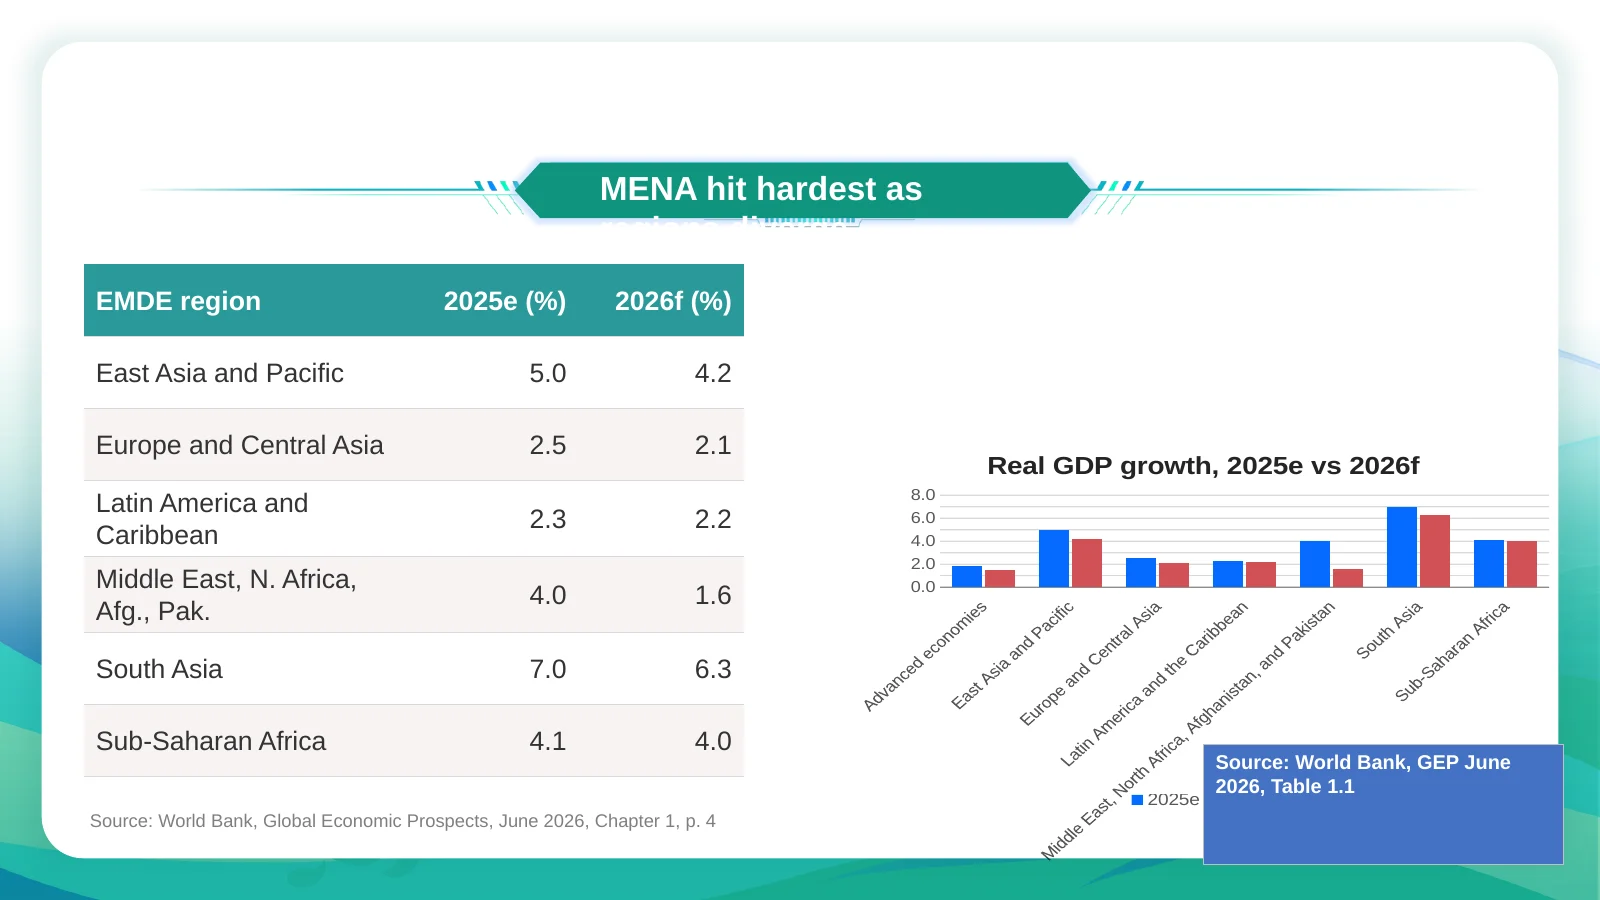
Slide 4 lists the six developing regions from Table 1.1 and calls out the Middle East, North Africa, Afghanistan and Pakistan, down from 4.0% growth in 2025 to 1.6% in 2026. Its title box is too narrow for the title, which stops after “MENA hit hardest as”.
Picture of the delivered fileSlide 4 as delivered. The numbers are the table’s; the title is cut short.
Put the risk scenarios on slide 5, where the template’s boxes are too small
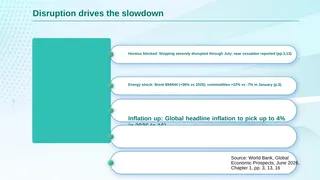
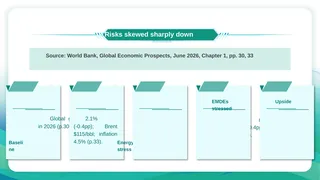
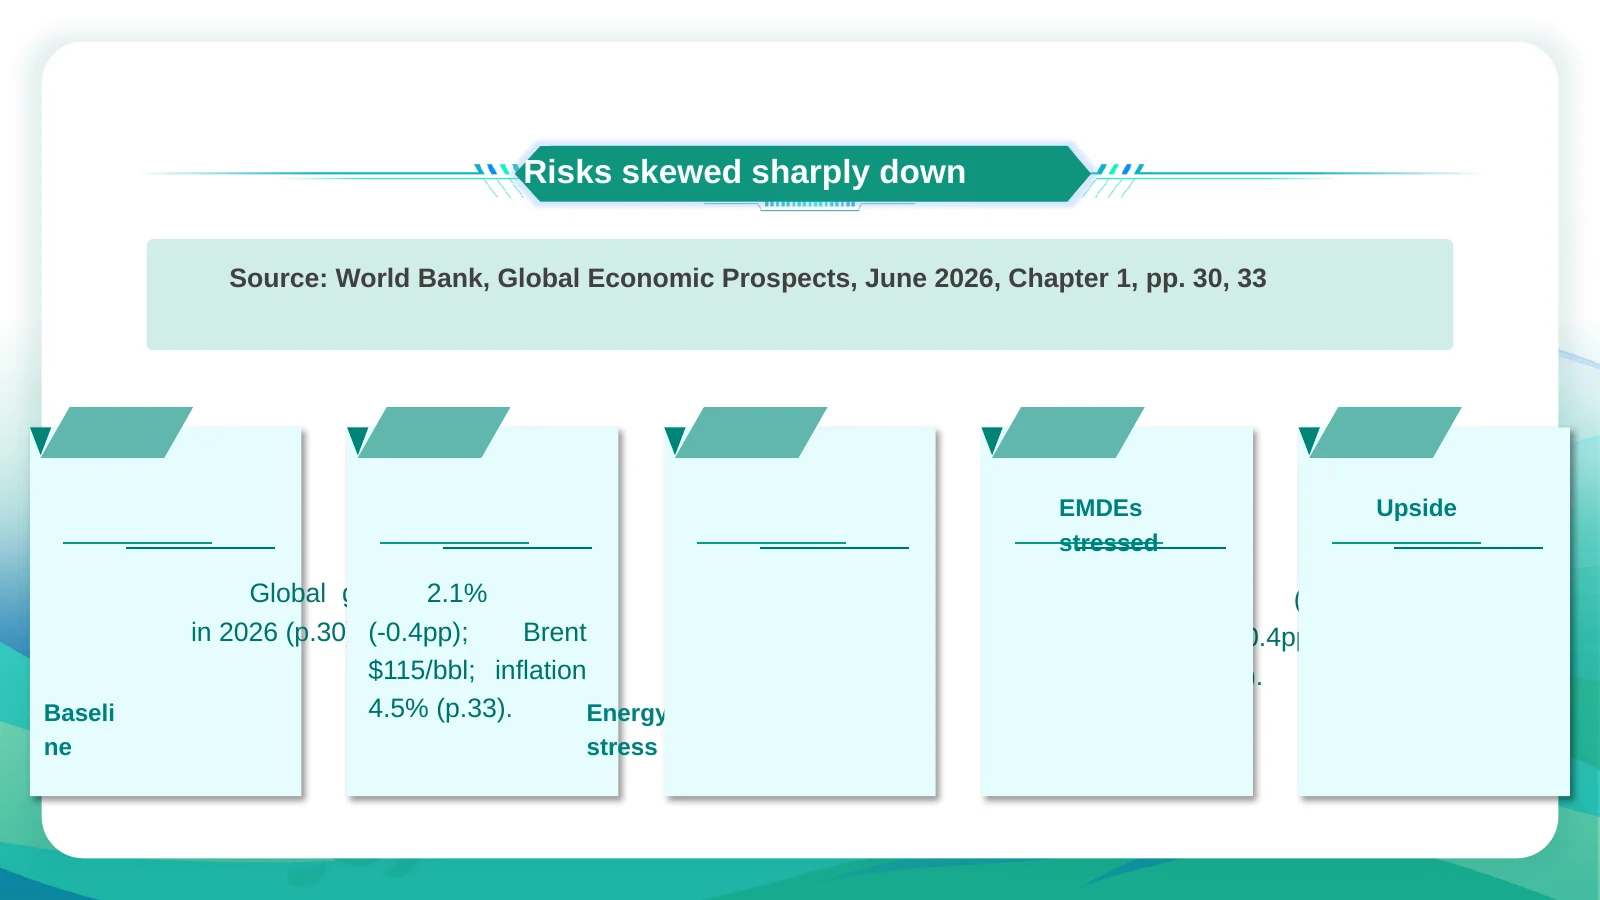
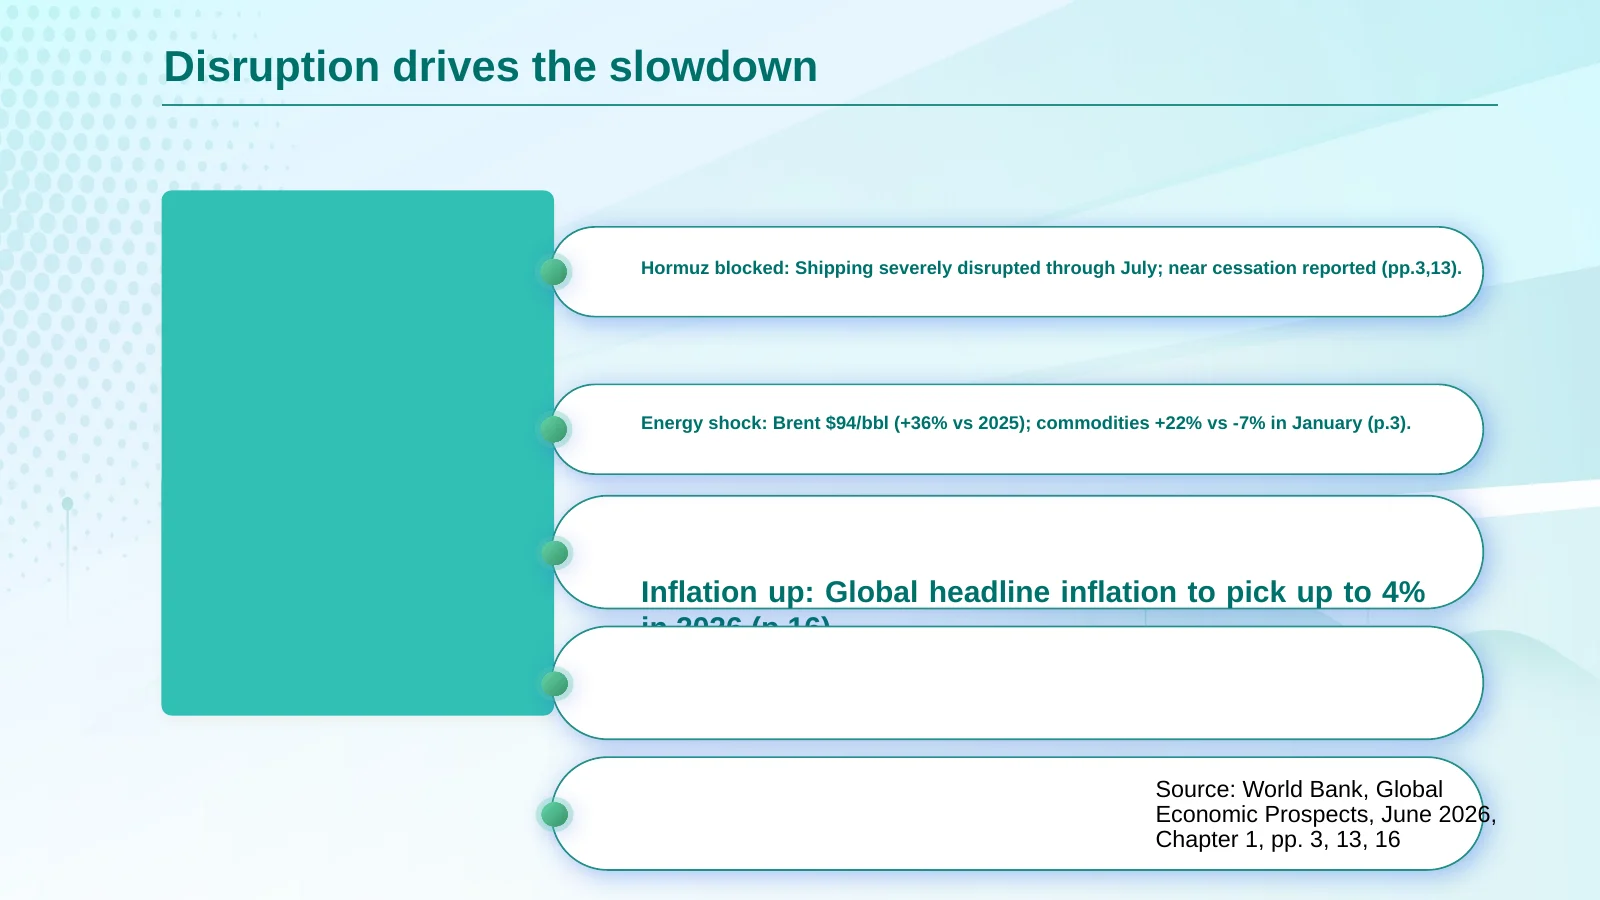
The chapter’s scenarios went into five cards: the baseline, energy stress at 2.1% global growth with oil at $115, the combined stress at 1.3%, developing economies under stress, and the upside. The cards are too small for the text, which spills out of them. Slide 3 has the same fault: one bullet runs out of its box and two boxes are empty.
Picture of the delivered fileSlide 5 as delivered. The figures are in the file and on the right page; the cards do not show them well.
Delivered six slides in the order asked
Title, headline numbers, what drives the slowdown, the regional picture, risks, and what it means for a manufacturer, with the source line on every slide. Click a slide to see it full size.
1Title
2Headline numbers: world growth 2.9% to 2.5%
3What drives the slowdown (one bullet spills out, two boxes empty)
4Regional picture: MENA 4.0% to 1.6% (title cut short)
5Risks: stress scenarios at 2.1% and 1.3% (cards too small)
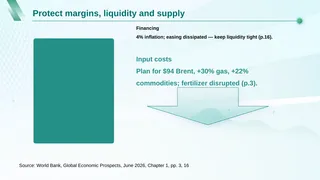
6So what for a manufacturer: margins, liquidity, supply
Checked every number against the PDF
We opened the chapter at each page the slides cite and compared the figures one by one.
✓Every figure on the deck is in the chapter, on the page the slide cites.
Asked for a chart on slide 4, built it from the Excel table in the same deck
The consultant
On slide 4, add a chart built from the attached Excel file (sheet 'Table 1.1'): a clustered bar chart of real GDP growth, 2025e vs 2026f, for Advanced economies and the six EMDE regions (East Asia and Pacific; Europe and Central Asia; Latin America and the Caribbean; Middle East, North Africa, Afghanistan, and Pakistan; South Asia; Sub-Saharan Africa).
- Use a real PowerPoint chart (editable data), not a picture
- Series named '2025e' and '2026f', values in percent with data labels
- Add 'Source: World Bank, GEP June 2026, Table 1.1' under the chart
- You may shorten the slide 4 bullets to make room; leave slides 1-3 and 5-6 untouched
Picked seven rows out of the World Bank’s sheet
The Excel file lists every region above its own country rows, with World and developing-economy totals. The chart needs advanced economies and the six regions, and nothing in between: no China, no Saudi Arabia, no totals.
GEP-Jun-2026-Table-1-1.xlsxattached
H19fx2.3
A
B
C
D
F
G
H
I
1
TABLE 1.1 Real GDP 1
…
4
2023
2024
2025e
2026f
5
World
2.8
2.9
2.9
2.5
6
Advanced economies
1.6
1.8
1.8
1.5
7
United States
2.9
2.8
2.1
2.2
…
10
Emerging market and developing economies
4.3
4.4
4.4
3.6
11
East Asia and Pacific
5.2
5.0
5.0
4.2
12
China
5.4
5.0
5.0
4.2
…
15
Europe and Central Asia
3.6
3.9
2.5
2.1
…
19
Latin America and the Caribbean
2.3
2.3
2.3
2.2
…
23
Middle East, North Africa, Afghanistan, and Pakistan
2.0
2.9
4.0
1.6
24
Saudi Arabia
0.5
2.6
4.5
3.1
…
27
South Asia
6.6
6.8
7.0
6.3
…
31
Sub-Saharan Africa
3.0
3.8
4.1
4.0
Table 1.1
The World Bank’s Excel file, as attached. Yellow rows are the seven the chart uses.
Opened the deck from request 1 and changed slide 4 only
No new deck. The slide 4 table was narrowed to make room, the chart placed beside it with the series named 2025e and 2026f, and the source line added under it. Slides 1 to 3 and 5 to 6 are as before. The bars have no value labels, although the request asked for them, and the source box covers part of the legend.
Picture of the delivered fileSlide 4 after request 2.
Left the chart’s data inside the file
It is a PowerPoint chart, not a picture: right-click it and choose Edit Data to see the 14 values. The chart on the right is drawn from the data inside the delivered file.
GEP Jun 2026 Ch1 Steering Committee.pptxslide 4
Real GDP growth, 2025e vs 2026f
Advanced economies1.81.5
East Asia and Pacific5.04.2
Europe and Central Asia2.52.1
Latin America and the Caribbean2.32.2
Middle East, North Africa, Afghanistan, and Pakistan4.01.6
South Asia7.06.3
Sub-Saharan Africa4.14.0
2025e
2026f
The chart on slide 4, redrawn here from the data inside the delivered file.
Checked the chart against the sheet and the deck against request 1
We read the 14 values out of the chart and compared them with columns H and I of the World Bank file, then compared the text of every other slide with the first deck.
✓14 of 14 values match the World Bank sheet, and no country row is in the chart.
✓Slides 1 to 3 and 5 to 6: the same text as after request 1.
Where the files come from: World Bank Group, Global Economic Prospects, June 2026: Chapter 1 and the Table 1.1 data file. This page is not affiliated with or endorsed by the World Bank.
Bring your own report
Most AI tools write slides from what they remember. reads the report you upload, cites the page for each figure, builds charts that keep their data, and keeps working in the same deck when you come back with more.