PRAXISBEISPIEL · EXCEL-ANALYSE
Den US-Solar-Betriebs- und Wartungsmarkt anhand von EIA-Daten schätzen
Eine Kundin wollte eine schnelle Top-down-Schätzung des US-Betriebs- und Wartungsmarkts für große Solaranlagen. Ihre Beraterin lud die Kapazitäts-Arbeitsmappe der EIA nach Bundesstaat hoch und bat , Solar zu filtern und Szenarien in derselben Excel-Datei zu analysieren.
ergänzte „Solar O&M“, filterte mit SUMIFS und analysierte die gewünschten Szenarien. Ein Diagramm und die bearbeitete Datei mit allen 57.778 Originalzeilen wurden geliefert. Auf weitere Anfrage folgten das günstigere 17-$-Szenario und eine Notiz zu Texas’ Überholen Kaliforniens.
1Der Upload: EIA-Kapazitätsmappe nach Bundesstaat, 57.778 Zeilen
- 57,778EIA-Zeilen unverändert
- $3.09bnBetriebs- und Wartungsmarkt 2025 bei 20 $/kW-Jahr
- 0.0MW-Abweichung von der EIA-US-Zeile
- 1Arbeitsmappe, für Anfrage 2 erneut bearbeitet
Die Originaldateien öffnen
Die EIA-Datei ist auf ihrer offiziellen Website verlinkt. Beide Arbeitsmappen stammen aus dem Durchlauf und enthalten das gesamte EIA-Blatt. Laden Sie sie herunter und öffnen Sie sie in Excel.
Woher die Datei stammt: U.S. Energy Information Administration, Stromdaten nach Staat: bestehende Nenn- und Netto-Sommerkapazität nach Energiequelle und Erzeugertyp, 1990–2025, aus Formular EIA-860. Gemeinfreies Werk der US-Regierung.
01 · DIE AUSGANGSDATEI
Ein Blatt, 57.778 Zeilen und zwei Fallen
Jede Zeile in „Existing Capacity“ steht für Jahr, Staat, Erzeugertyp und Brennstoff von 1990 bis 2025. Zwei Fallen: „Total Electric Power Industry“ summiert bereits die Erzeugertypen je Staat, „US“ summiert die Staaten. Alles zusammenzuzählen vervierfacht den Markt.
Eine normale Excel-Arbeitsmappe, keine Konvertierung nötig. Zu groß für einmaliges Lesen: schlug benötigte Werte nach und schrieb Formeln für das gesamte Blatt.
30766.8| A | B | C | D | E | F | G | H | |
|---|---|---|---|---|---|---|---|---|
| 1 | Existing Nameplate and Net Summer Capacity by Energy Source, Producer Type and State, 1990-2025 | |||||||
| 2 | Year | State Code | Producer Type | Fuel Source | Generators | Facilities | Nameplate Capacity (Megawatts) | Summer Capacity (Megawatts) |
| 3 | 1990 | AK | Combined Heat and Power, Commercial Power | All Sources | 4 | 85.9 | 80.09 | |
| … | ||||||||
| 57431 | 2025 | TX | Commercial Power | Solar Thermal and Photovoltaic | 2 | 2 | 3.1 | 3 |
| … | ||||||||
| 57439 | 2025 | TX | Electric Generators, Electric Utilities | Solar Thermal and Photovoltaic | 5 | 5 | 172 | 169 |
| … | ||||||||
| 57450 | 2025 | TX | Electric Generators, Independent Power Producers | Solar Thermal and Photovoltaic | 222 | 215 | 29853.8 | 29877.9 |
| … | ||||||||
| 57457 | 2025 | TX | Industrial Power | Solar Thermal and Photovoltaic | 8 | 4 | 737.9 | 737.9 |
| … | ||||||||
| 57468 | 2025 | TX | Total Electric Power Industry | Solar Thermal and Photovoltaic | 237 | 226 | 30766.8 | 30787.8 |
| … | ||||||||
| 57540 | 2025 | US | Total Electric Power Industry | Solar Thermal and Photovoltaic | 8012 | 7333 | 154300.6 | 153350 |
02 · ANFRAGE 1
„Den Solar-Betriebs- und Wartungsmarkt in dieser Arbeitsmappe schätzen“
Was der Berater eingab
Quick top-down sizing of the US utility-scale solar O&M market from the attached EIA file (sheet 'Existing Capacity').

Basis: rows with Fuel Source = 'Solar Thermal and Photovoltaic' and Producer Type = 'Total Electric Power Industry', column 'Nameplate Capacity (Megawatts)'. Use state rows only; the national total should be the sum of states and should agree with EIA's 'US' row.

Add a sheet 'Solar O&M' to this workbook with:
1. An input cell for O&M cost = $20 per kW-year, which all the calculations reference
2. National solar MW for 2020 and 2025, the 2020-2025 CAGR, and the 2025 O&M market in $
3. Top 10 states by 2025 MW: state, 2020 MW, 2025 MW, 2020-25 CAGR, share of US total, O&M $m
4. A bar chart of the top 10 states' O&M $m

Leave the 'Existing Capacity' sheet as it is.
Was getan hat
- Zunächst unterschiedliche Energiequellen, Erzeugertypen und Staatscodes nachgeschlagen, damit die Filter genau die Bezeichnungen aus der Datei verwenden.
- Blatt „Solar O&M“ in derselben Arbeitsmappe ergänzt; „Existing Capacity“ blieb unverändert.
- Kosten von 20 $ pro kW-Jahr in Eingabezelle B3 abgelegt. Alle Dollarwerte verweisen darauf.
- Jeder MW-Wert als dynamische SUMIFS-Formel auf dem EIA-Blatt: nur Solar, Branchensumme und Staaten. Klicken Sie unten auf eine grüne Zelle, um sie anzusehen.
- Zwei Prüfzeilen ergänzt: Staatensumme minus EIA-US-Zeile für 2020 und 2025. Beide ergeben 0,0.
- Top-10-Tabelle mit MW 2020 und 2025, Wachstum, US-Anteil und Betriebs-/Wartungswerten in Mio. Dollar erstellt, dazu ein echtes Excel-Balkendiagramm der entsprechenden Spalte.
=SUMIFS('Existing Capacity'!G:G,'Existing Capacity'!A:A,2025,'Existing Capacity'!D:D,"Solar Thermal and Photovoltaic",'Existing Capacity'!C:C,"Total Electric Power Industry",'Existing Capacity'!B:B,"<>US")| A | B | C | D | E | F | |
|---|---|---|---|---|---|---|
| 1 | ||||||
| 2 | ||||||
| 3 | O&M cost ($/kW-year) | 20 | ||||
| 4 | ||||||
| 5 | 2020 national solar MW (state sum) | 48,338.5 | ||||
| 6 | 2025 national solar MW (state sum) | 154,300.6 | ||||
| 7 | 2020 EIA US-row solar MW | 48,338.5 | ||||
| 8 | 2025 EIA US-row solar MW | 154,300.6 | ||||
| 9 | Check 2020 (state sum - US row) | 0.0 | ||||
| 10 | Check 2025 (state sum - US row) | 0.0 | ||||
| 11 | 2020-25 CAGR (national) | 26.1% | ||||
| 12 | 2025 O&M market ($) | 3,086,012,000 | ||||
| 13 | ||||||
| 14 | ||||||
| 15 | State | 2020 MW | 2025 MW | 2020-25 CAGR | Share of 2025 US total | 2025 O&M $m |
| 16 | TX | 4,879.5 | 30,766.8 | 44.5% | 19.9% | 615.3 |
| 17 | CA | 14,473.4 | 24,832.2 | 11.4% | 16.1% | 496.6 |
| 18 | FL | 3,785.1 | 12,300.6 | 26.6% | 8.0% | 246.0 |
| 19 | NC | 5,039.1 | 7,050.9 | 6.9% | 4.6% | 141.0 |
| 20 | AZ | 2,411.9 | 6,868.8 | 23.3% | 4.5% | 137.4 |
| 21 | NV | 2,517.9 | 5,479.9 | 16.8% | 3.6% | 109.6 |
| 22 | GA | 2,207.7 | 5,414.4 | 19.7% | 3.5% | 108.3 |
| 23 | VA | 1,301.0 | 5,180.3 | 31.8% | 3.4% | 103.6 |
| 24 | IN | 279.0 | 4,593.4 | 75.1% | 3.0% | 91.9 |
| 25 | OH | 112.8 | 4,486.5 | 108.9% | 2.9% | 89.7 |
| 26 | ||||||
| 27 | National total is the state sum (State Code <>US) and agrees with the EIA US row. | |||||
Top 10 states by 2025 solar O&M ($m)
Mit EIA-Daten abgeglichen: 154.300,6 MW Solar 2025 und 48.338,5 MW 2020, jährlich 26,1 % Wachstum, 3.086.012.000 $ Markt bei 20 $ und die richtigen zehn Staaten in richtiger Reihenfolge. Eine geänderte Eingabezelle aktualisiert alle Dollarwerte. Alle 57.780 EIA-Zeilen bleiben unverändert.
03 · ANFRAGE 2
„Ein 17-$-Szenario und eine Notiz zu Texas ergänzen“
Was der Berater eingab
The partner thinks $20/kW-yr is rich. On the same 'Solar O&M' sheet:

1. Add a second scenario at $17/kW-yr next to the $20 case (its own input cell), for the national total and the top-10 O&M column
2. Show the scenario in the existing bar chart
3. Add a short note under the table: Texas overtook California in 2025 - by how many MW, and what was the gap in 2024?

Keep the rest of the sheet as it is.
Was getan hat
- Die gerade bearbeitete Arbeitsmappe geöffnet und im selben Blatt „Solar O&M“ weitergearbeitet.
- Zweite Eingabezelle C3 = 17 neben der 20-$-Zelle und nationale 17-$-Summe neben der 20-$-Summe ergänzt.
- 17-$-Spalte in der Top-10-Tabelle ergänzt, verknüpft mit der neuen Eingabezelle.
- 2024 und 2025 nachgeschlagen und unter der Tabelle notiert: Texas 2025 um 5.934,6 MW voraus, Kalifornien 2024 um 97,3 MW.
- Keine Zelle aus Anfrage 1 verändert. Wir haben jede geprüft.
=B6*1000*$C$3| A | B | C | D | E | F | G | |
|---|---|---|---|---|---|---|---|
| 1 | |||||||
| 2 | $20/kW-yr case | $17/kW-yr case | |||||
| 3 | O&M cost ($/kW-year) | 20 | 17 | ||||
| 4 | |||||||
| 5 | 2020 national solar MW (state sum) | 48,338.5 | |||||
| 6 | 2025 national solar MW (state sum) | 154,300.6 | |||||
| 7 | 2020 EIA US-row solar MW | 48,338.5 | |||||
| 8 | 2025 EIA US-row solar MW | 154,300.6 | |||||
| 9 | Check 2020 (state sum - US row) | 0.0 | |||||
| 10 | Check 2025 (state sum - US row) | 0.0 | |||||
| 11 | 2020-25 CAGR (national) | 26.1% | |||||
| 12 | 2025 O&M market ($) | 3,086,012,000 | 2623110200 | ||||
| 13 | |||||||
| 14 | |||||||
| 15 | State | 2020 MW | 2025 MW | 2020-25 CAGR | Share of 2025 US total | 2025 O&M $m | 2025 O&M $m ($17/kW-yr) |
| 16 | TX | 4,879.5 | 30,766.8 | 44.5% | 19.9% | 615.3 | 523.0356 |
| 17 | CA | 14,473.4 | 24,832.2 | 11.4% | 16.1% | 496.6 | 422.1474 |
| 18 | FL | 3,785.1 | 12,300.6 | 26.6% | 8.0% | 246.0 | 209.1102 |
| 19 | NC | 5,039.1 | 7,050.9 | 6.9% | 4.6% | 141.0 | 119.8653 |
| 20 | AZ | 2,411.9 | 6,868.8 | 23.3% | 4.5% | 137.4 | 116.7696 |
| 21 | NV | 2,517.9 | 5,479.9 | 16.8% | 3.6% | 109.6 | 93.1583 |
| 22 | GA | 2,207.7 | 5,414.4 | 19.7% | 3.5% | 108.3 | 92.0448 |
| 23 | VA | 1,301.0 | 5,180.3 | 31.8% | 3.4% | 103.6 | 88.0651 |
| 24 | IN | 279.0 | 4,593.4 | 75.1% | 3.0% | 91.9 | 78.0878 |
| 25 | OH | 112.8 | 4,486.5 | 108.9% | 2.9% | 89.7 | 76.2705 |
| 26 | Texas overtook California in 2025 by about 5,935 MW (TX 30,766.8 vs CA 24,832.2, gap 5,934.6 MW) while in 2024 California still led by about 97 MW (CA 22,562.9 vs TX 22,465.6, gap 97.3 MW). | ||||||
| 27 | National total is the state sum (State Code <>US) and agrees with the EIA US row. | ||||||
Mit EIA-Daten abgeglichen: 2.623.110.200 $ bei 17 $ gegenüber 3.086.012.000 $ bei 20 $; Texas bei 17 $: 523,0 Mio. $. 2025: Texas 30.766,8 MW, Kalifornien 24.832,2; 2024: Kalifornien 22.562,9, Texas 22.465,6. Beide Abgleiche stimmen.
Analyse, die in der Arbeitsmappe des Kunden bleibt
Eine Chatantwort liefert Zahlen zum Abtippen. arbeitet in Ihrer Tabelle: Formeln auf echten Zeilen, Abgleich der Summe mit der Quelle und veränderbare Eingaben. Das nächste Szenario ist nur eine Zelle entfernt.
WEITERLESEN
Ein weiteres Praxisbeispiel lesen
Banker und Berater
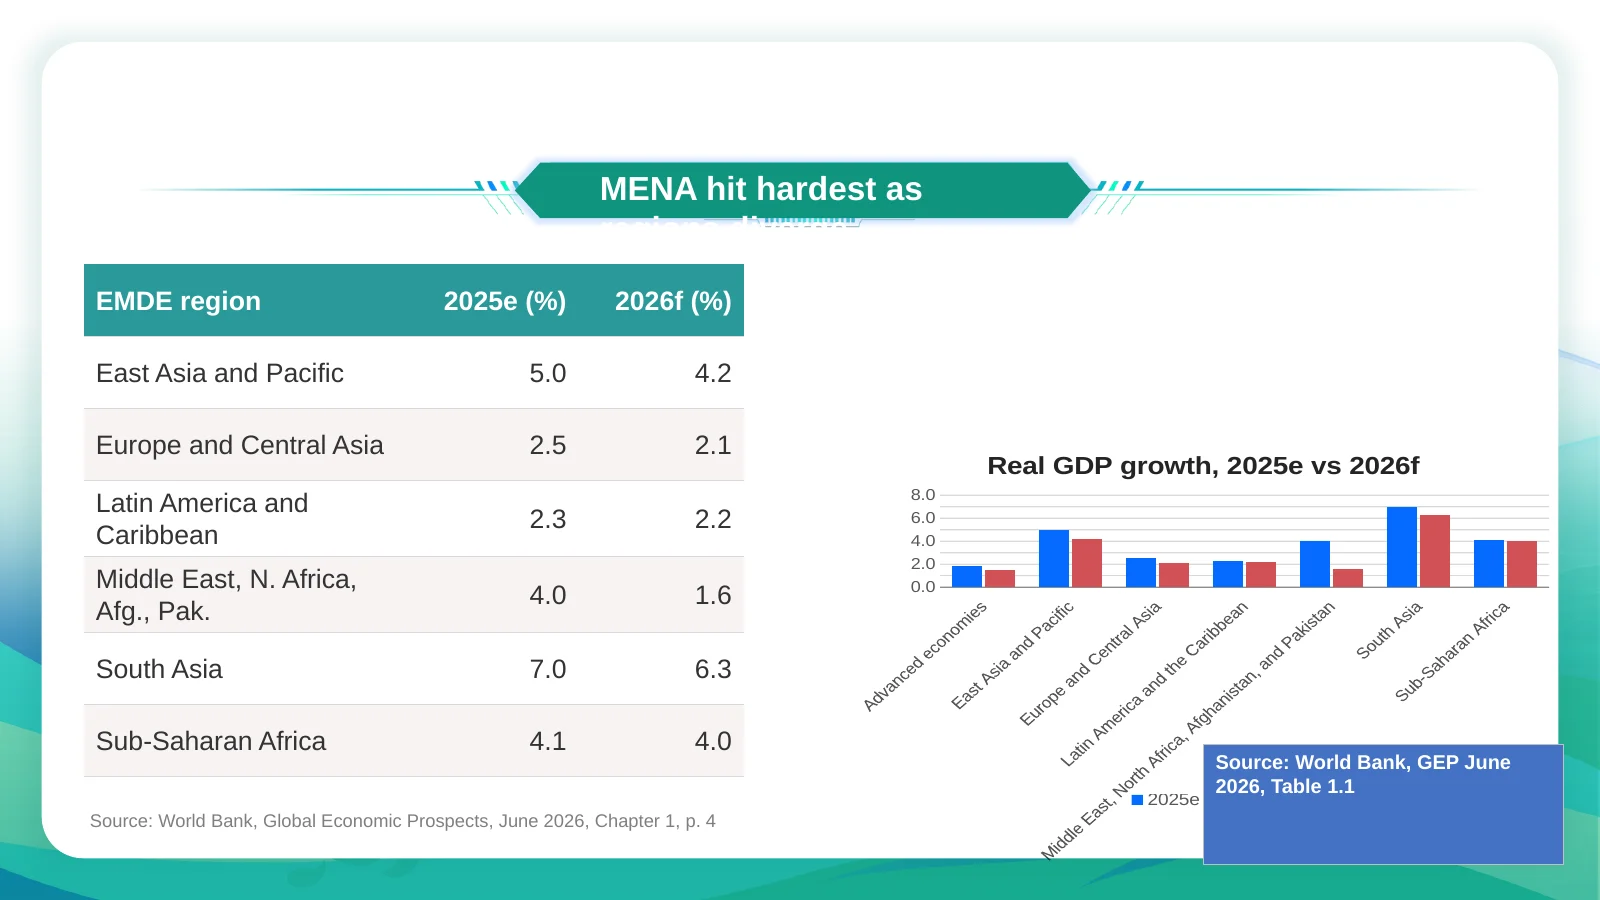
Ein Weltbank-Ausblickskapitel in eine Kunden-Präsentation für den Lenkungsausschuss verwandeln
Banker und Berater
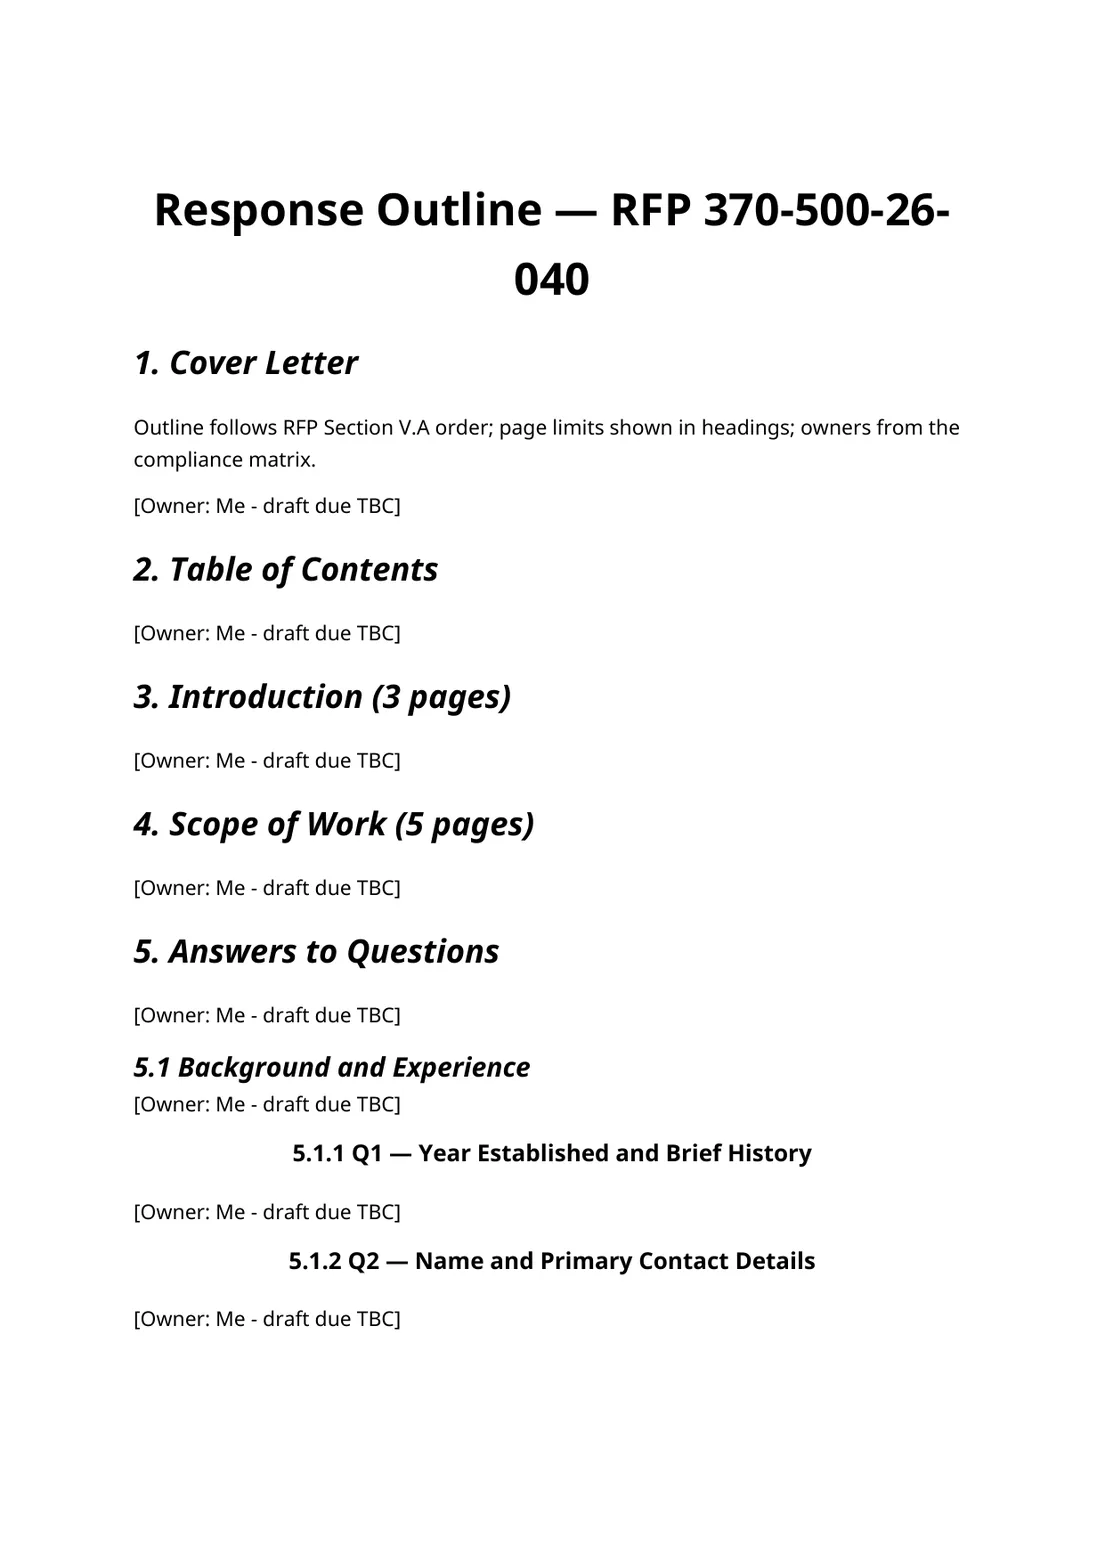
Staatliche RFP in eine Compliance-Matrix umgewandelt, dann eine Antwort-Gliederung
Banker und Berater
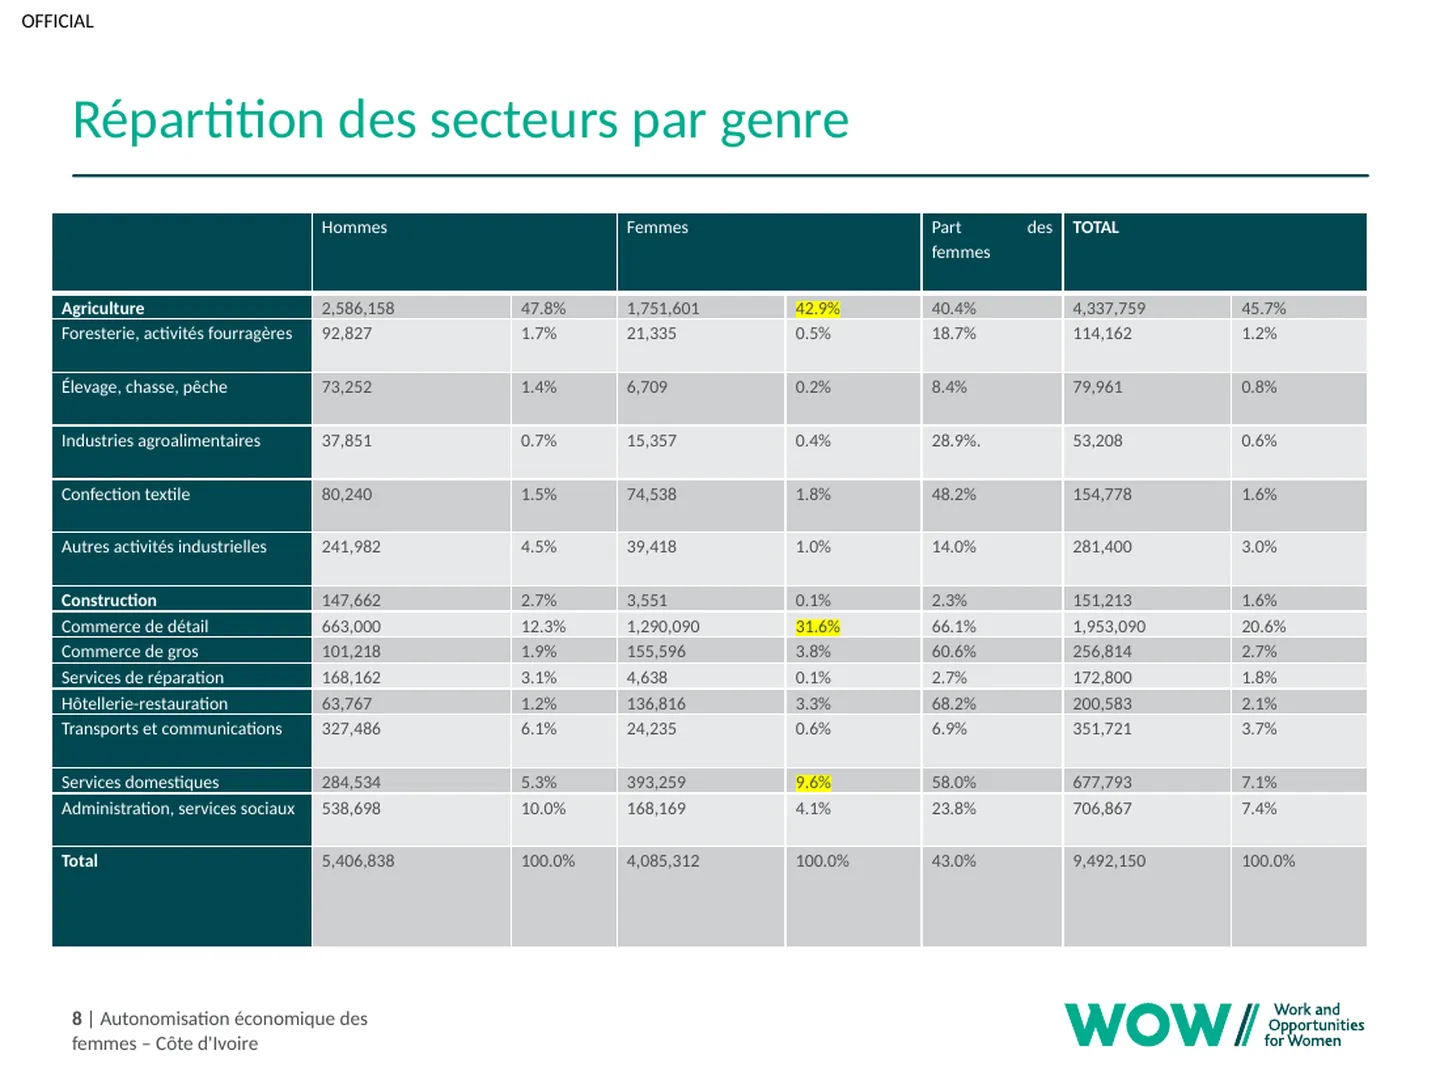
Eine Entwicklungspräsentation mit 23 Folien auf Französisch, dann drei Korrekturen
Alle 19 Praxisbeispiele ansehen →Alle Beispiele für Banker und Berater →