实操示例 · EXCEL 和 POWERPOINT
将 OMB 预算表格转换为 Excel 图表和汇报演示文稿
一位预算分析师收到了一份包含 1940 年至 2031 年美国政府开支的 Excel 文件。他们请 提取四大支出项目,并为上司绘制图表。
通过创建一个包含 2015 年至 2031 年国防、医疗保险、社会保障和利息成本的表格来分析数据,并在同一个 Excel 文件中绘制了图表。然后,该图表作为真正的图表(而非图片)被放到了 PowerPoint 幻灯片中。
1分析师上传时的原始 Excel 文件
A1fx
2015201620172018
国防589,659593,372598,722631,130
国际事务52,04045,30646,30949,002
联邦医疗保险546,202594,536597,307588,706
社会保障887,753916,067944,878987,791
农业18,50018,34418,87221,789
净利息223,181240,033262,551325,000
TableBig Four
- 2用通俗英文提出的请求
- 1已编辑 Excel 文件,而非替换
- 1基于此构建的演示文稿
- 0手动输入的公式
打开真实文件
这些是运行操作产生的实际文件。下载它们并在 Excel 或 PowerPoint 中打开。
文件来源: OMB Historical Tables, 表 3.1,按大类职能和职能划分的支出,2027 财年预算。
01 · 初始文件
一个庞大而杂乱的政府电子表格
该文件列出了从 1940 年到 2031 年的各类联邦开支,每列代表一年,共 94 列。它有几个陷阱:1976 年之后挤进了一个额外的“TQ”列,而 2025 年之后的年份被标记为“2026 estimate”等。
BZ4
589,659| A | B | … | AL | AM | AN | … | BZ | CA | … | CI | CJ | CK | … | CP | |
|---|---|---|---|---|---|---|---|---|---|---|---|---|---|---|---|
| 1 | Table 3.1 - OUTLAYS BY SUPERFUNCTION AND FUNCTION: 1940 - 2031 | … | … | … | … | ||||||||||
| 2 | Superfunction and Function | 1940 | … | 1976 | TQ | 1977 | … | 2015 | 2016 | … | 2024 | 2025 | 2026 estimate | … | 2031 estimate |
| 3 | In millions of dollars: | … | … | … | … | ||||||||||
| 4 | National Defense | 1,660 | … | 89,619 | 22,269 | 97,241 | … | 589,659 | 593,372 | … | 873,523 | 916,140 | 966,396 | … | 1,369,123 |
| 5 | Human resources | 4,139 | … | 203,594 | 52,065 | 221,895 | … | 2,706,828 | 2,820,292 | … | 4,548,904 | 4,706,716 | 5,078,303 | … | 6,347,219 |
| 6 | Education, Training, Employment, and Social Services | 1,972 | … | 18,910 | 5,169 | 21,104 | … | 122,035 | 109,709 | … | 306,370 | 72,042 | 101,970 | … | 133,413 |
| 7 | Health | 55 | … | 15,734 | 3,924 | 17,302 | … | 482,257 | 511,325 | … | 911,290 | 978,511 | 1,047,526 | … | 1,143,249 |
| 8 | Medicare | .......... | … | 15,834 | 4,264 | 19,345 | … | 546,202 | 594,536 | … | 874,133 | 996,718 | 1,070,248 | … | 1,573,538 |
| 9 | Income Security | 1,514 | … | 60,784 | 14,981 | 61,045 | … | 508,800 | 514,098 | … | 670,548 | 701,609 | 741,971 | … | 743,752 |
| 10 | Social Security | 28 | … | 73,899 | 19,763 | 85,061 | … | 887,753 | 916,067 | … | 1,460,918 | 1,580,673 | 1,676,441 | … | 2,151,475 |
| … | |||||||||||||||
| 22 | Net interest | 899 | … | 26,727 | 6,949 | 29,901 | … | 223,181 | 240,033 | … | 879,879 | 970,065 | 1,016,650 | … | 1,363,769 |
| … | |||||||||||||||
| 35 | Total, Federal outlays | 9,468 | … | 371,792 | 95,975 | 409,218 | … | 3,691,850 | 3,852,615 | … | 6,735,261 | 7,011,105 | 7,540,434 | … | 9,279,779 |
| … | |||||||||||||||
| 39 | National defense | 17.5 | … | 24.1 | 23.2 | 23.8 | … | 16.0 | 15.4 | … | 13.0 | 13.1 | 12.8 | … | 14.8 |
| 42 | Net interest | 9.5 | … | 7.2 | 7.2 | 7.3 | … | 6.0 | 6.2 | … | 13.1 | 13.8 | 13.5 | … | 14.7 |
Table
02 · 请求 1
“添加汇总表和图表”
分析师输入的内容
In the attached OMB Historical Table 3.1 (FY2027 Budget), please add a new sheet called 'Big Four' and leave the 'Table' sheet exactly as it is. On the new sheet:
1. Column A: fiscal years 2015 to 2031, one row per year (17 rows).
2. Columns B-E: National Defense (row 4), Medicare (row 8), Social Security (row 10) and Net interest (row 22) from the Table sheet, converted from $ millions to $ billions, one decimal. Use formulas that point at the Table sheet if you can.
3. Column F: 'Actual' for 2015-2025 and 'Estimate' for 2026-2031 (the columns headed '2026 estimate' to '2031 estimate').
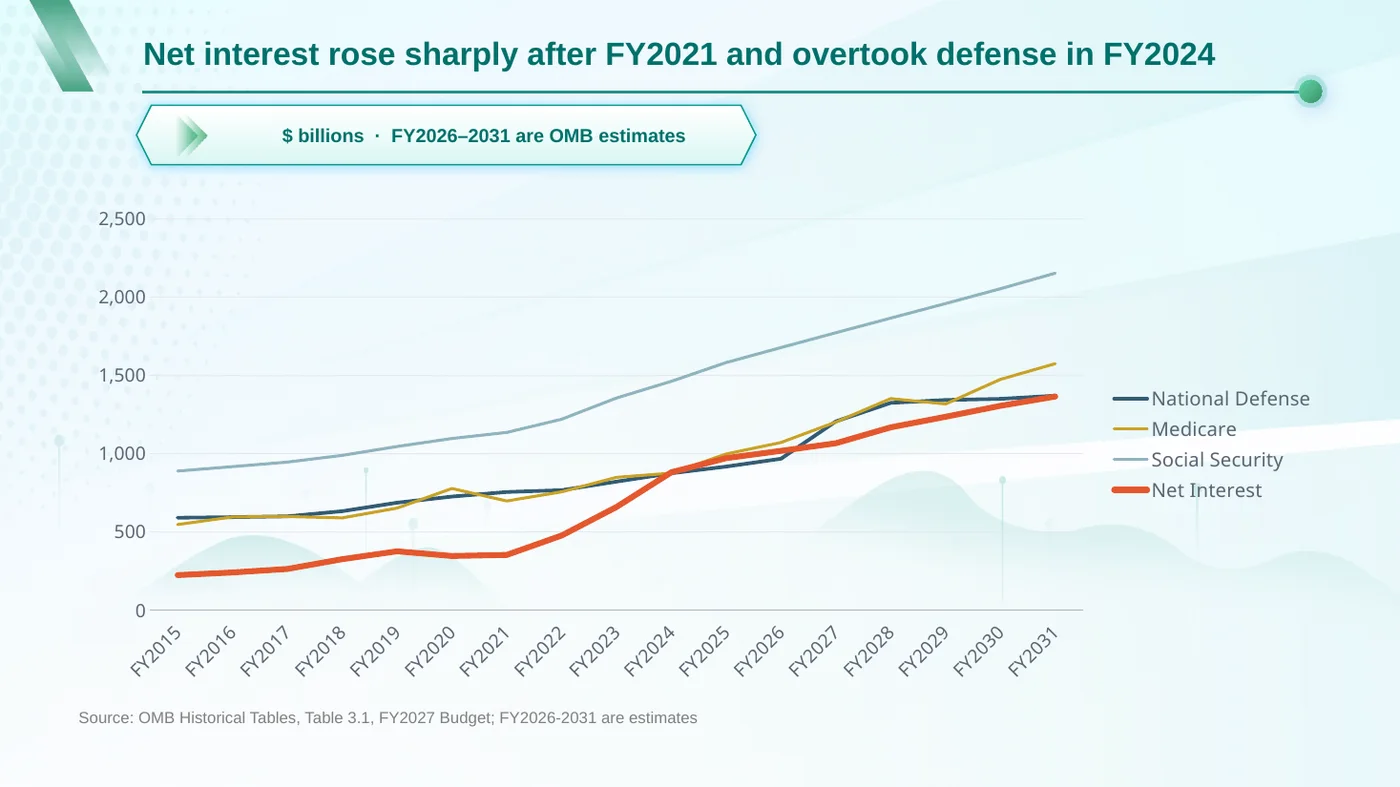
4. A native Excel line chart of the four series with years on the x-axis, titled 'Federal outlays by function, FY2015-FY2031 ($ billions)', with a note that 2026-2031 are OMB estimates.
的操作
- 在上传的 Excel 文件内部进行工作。未创建新文件。
- 首先核对年份标签,确保尽管多出了一个“TQ”列,2015年仍然能与正确的列对齐。
- 添加了一个名为“Big Four”的新工作表:2015 年至 2031 年每年一行,包含以十亿美元为单位的四个支出项目,以及“Actual”或“Estimate”标签。
- 填充了指向原始工作表的公式,因此每一个数字都可以追溯。点击下方的绿色单元格即可查看。
- 绘制了一个可点击并编辑的真正的 Excel 折线图。
- 未改动原始工作表。我们检查了每一个单元格。
B2
=ROUND(Table!BZ4/1000,1)| A | B | C | D | E | F | |
|---|---|---|---|---|---|---|
| 1 | Fiscal Year | National Defense ($ billions) | Medicare ($ billions) | Social Security ($ billions) | Net Interest ($ billions) | Type |
| 2 | 2015 | 589.7 | 546.2 | 887.8 | 223.2 | Actual |
| 3 | 2016 | 593.4 | 594.5 | 916.1 | 240 | Actual |
| 4 | 2017 | 598.7 | 597.3 | 944.9 | 262.6 | Actual |
| 5 | 2018 | 631.3 | 588.7 | 987.8 | 325 | Actual |
| 6 | 2019 | 685.7 | 651 | 1044.4 | 375.2 | Actual |
| 7 | 2020 | 724.6 | 776.2 | 1095.8 | 345.5 | Actual |
| 8 | 2021 | 753.9 | 696.5 | 1134.6 | 352.3 | Actual |
| 9 | 2022 | 765.6 | 755.1 | 1218.7 | 475.9 | Actual |
| 10 | 2023 | 820.3 | 847.5 | 1354.3 | 658.3 | Actual |
| 11 | 2024 | 873.5 | 874.1 | 1460.9 | 879.9 | Actual |
| 12 | 2025 | 916.1 | 996.7 | 1580.7 | 970.1 | Actual |
| 13 | 2026 | 966.4 | 1070.2 | 1676.4 | 1016.7 | Estimate |
| 14 | 2027 | 1205 | 1200.8 | 1771.1 | 1065.4 | Estimate |
| 15 | 2028 | 1323.2 | 1350.5 | 1864.4 | 1167 | Estimate |
| 16 | 2029 | 1341.6 | 1316.2 | 1957.3 | 1234.6 | Estimate |
| 17 | 2030 | 1348.8 | 1473.4 | 2052.1 | 1304.5 | Estimate |
| 18 | 2031 | 1369.1 | 1573.5 | 2151.5 | 1363.8 | Estimate |
| 20 | Note: 2026-2031 are OMB estimates. | |||||
TableBig Four新
Federal outlays by function, FY2015-FY2031 ($ billions)
- National Defense ($ billions)
- Medicare ($ billions)
- Social Security ($ billions)
- Net Interest ($ billions)
AI 对数据进行了双重核对: 2015年的国防支出 589.7、医疗保险 546.2、社会保障 887.8 以及利息 223.2(单位:十亿美元)均与政府官方数据完全一致。
03 · 请求 2
“现在把它做成三张幻灯片”
分析师输入的内容
Now build a 3-slide PowerPoint for the Deputy Secretary from the 'Big Four' sheet:
1. Title slide: 'Interest costs vs. defense, Medicare and Social Security', subtitle 'FY2015-FY2031, OMB Historical Table 3.1 (FY2027 Budget)'.
2. The line chart, with a one-line headline stating what it shows, and 'Source: OMB Historical Tables, Table 3.1, FY2027 Budget; FY2026-2031 are estimates' at the bottom.
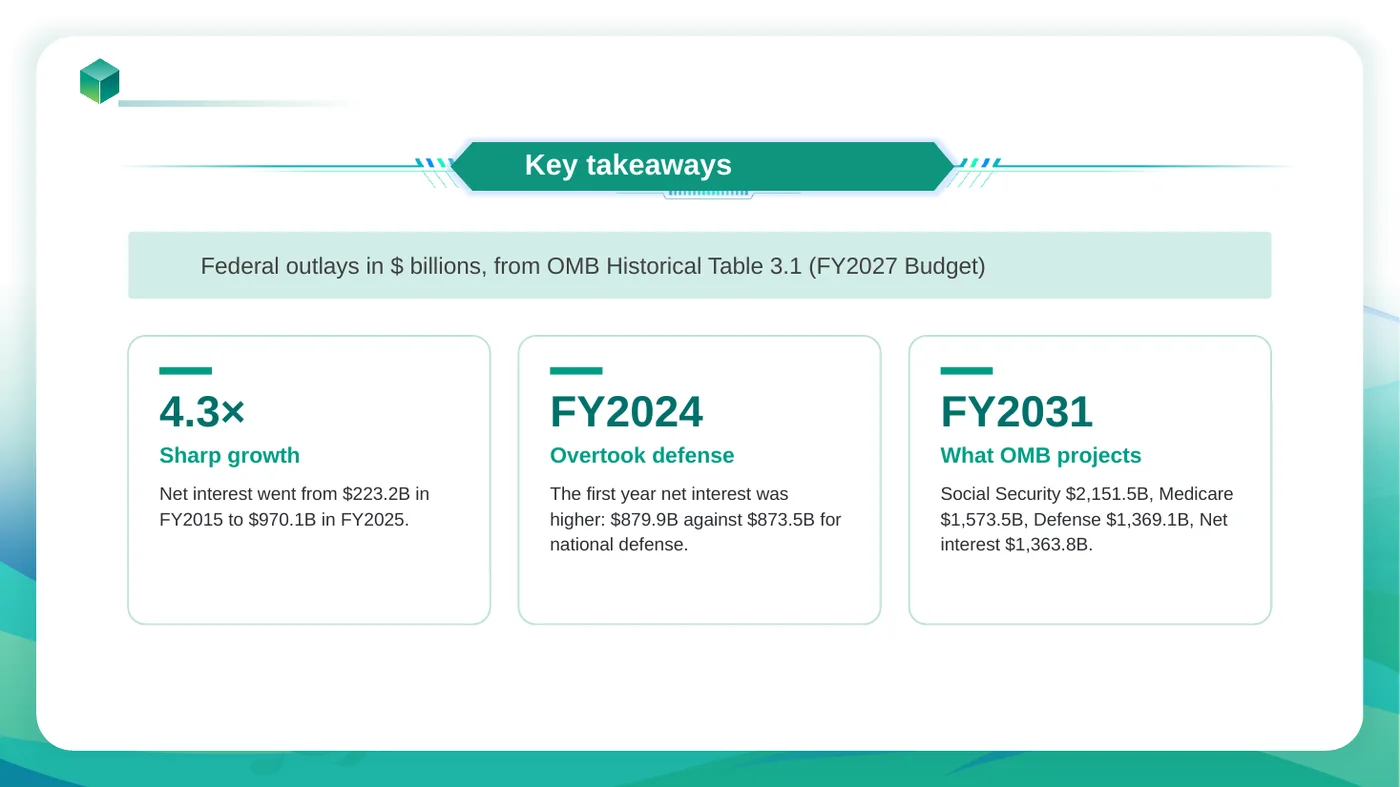
3. Three takeaways, each with figures from the sheet: (a) how net interest grew from FY2015 to FY2025; (b) the first fiscal year in which net interest exceeded national defense, with both amounts; (c) what OMB projects for the four lines in FY2031.

Plain government style, no stock images.
的操作
- 读取刚刚制作的“Big Four”工作表,以确保幻灯片和电子表格显示相同的数字。
- 让分析师从其模板库中选择一种设计。
- 将图表作为真正的 PowerPoint 图表放入第 2 张幻灯片中,其数据包含在内。右键点击它并选择“编辑数据”。
- 从数据中写出要点:利息成本从 2015 年到 2025 年增长了 4.3 倍,并在 2024 年首次超过国防支出。
直接在你的原文件中编辑
大多数 AI 工具读取你的电子表格后只交给你一个新的表格。 会打开你上传的文件,仅修改你要求的部分,并保留每一个早期版本。
继续阅读