작업 예시 · EXCEL 및 POWERPOINT
OMB 예산 표를 Excel 차트와 브리핑 슬라이드로
한 예산 분석가가 1940년부터 2031년까지의 미국 정부 지출이 담긴 Excel 파일을 받았습니다. 상사에게 보고할 수 있도록 주요 지출 항목 4개를 추출해 차트로 만들어 달라고 에 요청했습니다.
는 2015년부터 2031년까지의 국방, 메디케어, 사회보장, 이자 비용 표를 만들어 데이터를 분석하고 같은 Excel 파일에 차트를 그렸습니다. 그런 다음 그 차트를 그림이 아닌 실제 차트로 PowerPoint 슬라이드에 넣었습니다.
1분석가가 업로드한 원본 Excel 파일
- 2쉬운 영어로 한 요청
- 1교체되지 않고 편집된 Excel 파일
- 1이를 기반으로 제작된 슬라이드 덱
- 0수동으로 입력한 수식
실제 파일 열기
이 파일들은 실행 과정에서 생성된 실제 파일입니다. 다운로드하여 Excel이나 PowerPoint에서 여세요.
파일 출처: OMB Historical Tables, 표 3.1, 상위 기능 및 기능별 지출, FY2027 예산안.
01 · 시작 파일
크고 복잡한 정부 스프레드시트
이 파일은 1940년부터 2031년까지의 모든 연방 지출 유형을 열당 1년씩 나열하고 있습니다. 총 94개의 열입니다. 1976년 이후에 끼워진 추가 "TQ" 열과 2025년 이후의 "2026년 추정" 등으로 표시된 연도와 같은 몇 가지 함정이 있습니다.
589,659| A | B | … | AL | AM | AN | … | BZ | CA | … | CI | CJ | CK | … | CP | |
|---|---|---|---|---|---|---|---|---|---|---|---|---|---|---|---|
| 1 | Table 3.1 - OUTLAYS BY SUPERFUNCTION AND FUNCTION: 1940 - 2031 | … | … | … | … | ||||||||||
| 2 | Superfunction and Function | 1940 | … | 1976 | TQ | 1977 | … | 2015 | 2016 | … | 2024 | 2025 | 2026 estimate | … | 2031 estimate |
| 3 | In millions of dollars: | … | … | … | … | ||||||||||
| 4 | National Defense | 1,660 | … | 89,619 | 22,269 | 97,241 | … | 589,659 | 593,372 | … | 873,523 | 916,140 | 966,396 | … | 1,369,123 |
| 5 | Human resources | 4,139 | … | 203,594 | 52,065 | 221,895 | … | 2,706,828 | 2,820,292 | … | 4,548,904 | 4,706,716 | 5,078,303 | … | 6,347,219 |
| 6 | Education, Training, Employment, and Social Services | 1,972 | … | 18,910 | 5,169 | 21,104 | … | 122,035 | 109,709 | … | 306,370 | 72,042 | 101,970 | … | 133,413 |
| 7 | Health | 55 | … | 15,734 | 3,924 | 17,302 | … | 482,257 | 511,325 | … | 911,290 | 978,511 | 1,047,526 | … | 1,143,249 |
| 8 | Medicare | .......... | … | 15,834 | 4,264 | 19,345 | … | 546,202 | 594,536 | … | 874,133 | 996,718 | 1,070,248 | … | 1,573,538 |
| 9 | Income Security | 1,514 | … | 60,784 | 14,981 | 61,045 | … | 508,800 | 514,098 | … | 670,548 | 701,609 | 741,971 | … | 743,752 |
| 10 | Social Security | 28 | … | 73,899 | 19,763 | 85,061 | … | 887,753 | 916,067 | … | 1,460,918 | 1,580,673 | 1,676,441 | … | 2,151,475 |
| … | |||||||||||||||
| 22 | Net interest | 899 | … | 26,727 | 6,949 | 29,901 | … | 223,181 | 240,033 | … | 879,879 | 970,065 | 1,016,650 | … | 1,363,769 |
| … | |||||||||||||||
| 35 | Total, Federal outlays | 9,468 | … | 371,792 | 95,975 | 409,218 | … | 3,691,850 | 3,852,615 | … | 6,735,261 | 7,011,105 | 7,540,434 | … | 9,279,779 |
| … | |||||||||||||||
| 39 | National defense | 17.5 | … | 24.1 | 23.2 | 23.8 | … | 16.0 | 15.4 | … | 13.0 | 13.1 | 12.8 | … | 14.8 |
| 42 | Net interest | 9.5 | … | 7.2 | 7.2 | 7.3 | … | 6.0 | 6.2 | … | 13.1 | 13.8 | 13.5 | … | 14.7 |
02 · 요청 1
요약 표 및 차트 추가
분석가의 입력 내용
In the attached OMB Historical Table 3.1 (FY2027 Budget), please add a new sheet called 'Big Four' and leave the 'Table' sheet exactly as it is. On the new sheet:
1. Column A: fiscal years 2015 to 2031, one row per year (17 rows).
2. Columns B-E: National Defense (row 4), Medicare (row 8), Social Security (row 10) and Net interest (row 22) from the Table sheet, converted from $ millions to $ billions, one decimal. Use formulas that point at the Table sheet if you can.
3. Column F: 'Actual' for 2015-2025 and 'Estimate' for 2026-2031 (the columns headed '2026 estimate' to '2031 estimate').
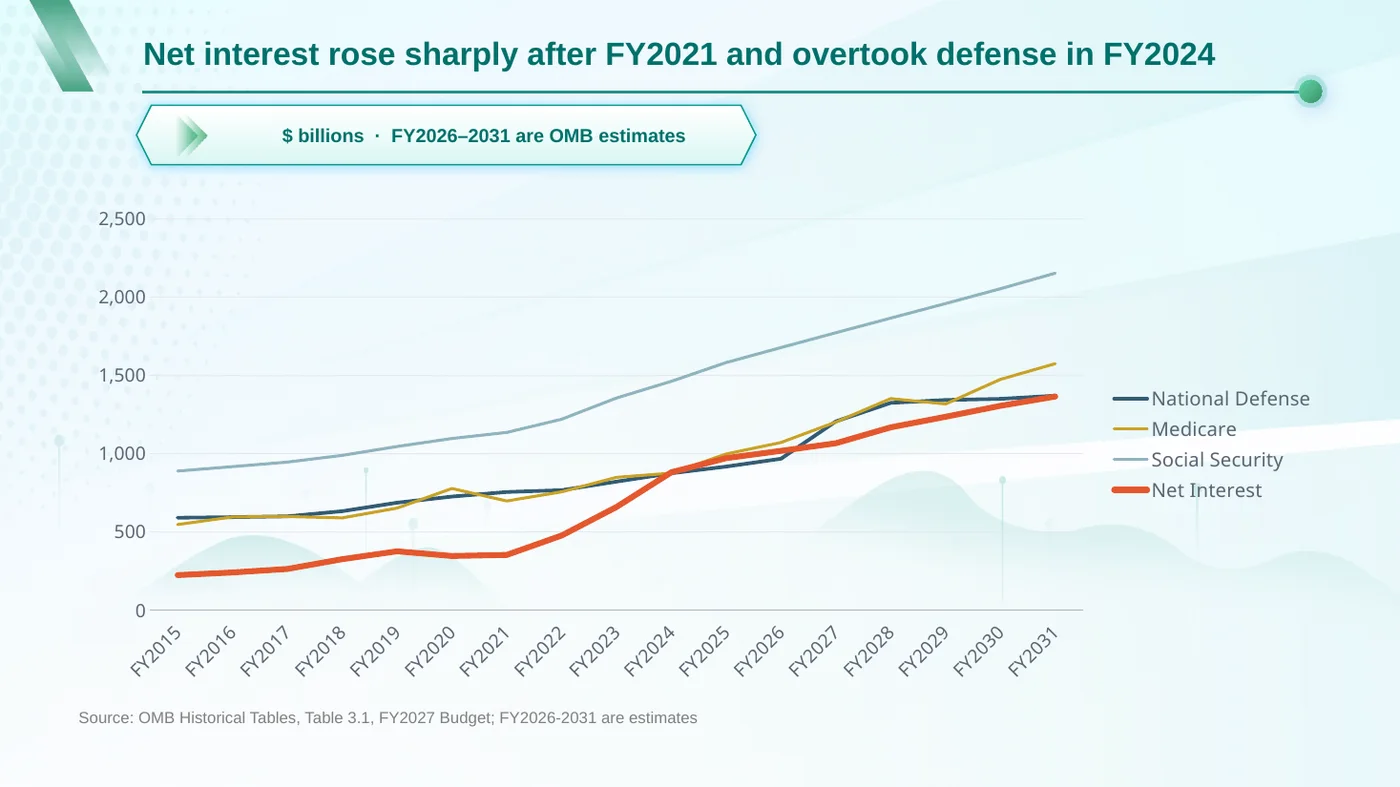
4. A native Excel line chart of the four series with years on the x-axis, titled 'Federal outlays by function, FY2015-FY2031 ($ billions)', with a note that 2026-2031 are OMB estimates.
의 처리 내용
- 업로드된 Excel 파일 안에서 작업했습니다. 새 파일을 만들지 않았습니다.
- 연도 라벨을 먼저 확인하여, 추가된 TQ 열에도 불구하고 2015년이 올바른 열에 정렬되도록 했습니다.
- “Big Four”라는 새 시트를 추가했습니다. 2015년부터 2031년까지 연도별 1개 행, 십억 달러 단위의 4가지 지출 항목, 그리고 “Actual”(실적) 또는 “Estimate”(추정) 라벨로 구성됩니다.
- 원본 시트를 참조하는 수식으로 채워 모든 숫자를 추적할 수 있습니다. 아래의 초록색 셀을 클릭하여 확인해 보세요.
- 클릭하여 편집할 수 있는 실제 Excel 꺾은선형 차트를 그렸습니다.
- 원본 시트는 수정하지 않았습니다. 모든 셀을 확인했습니다.
=ROUND(Table!BZ4/1000,1)| A | B | C | D | E | F | |
|---|---|---|---|---|---|---|
| 1 | Fiscal Year | National Defense ($ billions) | Medicare ($ billions) | Social Security ($ billions) | Net Interest ($ billions) | Type |
| 2 | 2015 | 589.7 | 546.2 | 887.8 | 223.2 | Actual |
| 3 | 2016 | 593.4 | 594.5 | 916.1 | 240 | Actual |
| 4 | 2017 | 598.7 | 597.3 | 944.9 | 262.6 | Actual |
| 5 | 2018 | 631.3 | 588.7 | 987.8 | 325 | Actual |
| 6 | 2019 | 685.7 | 651 | 1044.4 | 375.2 | Actual |
| 7 | 2020 | 724.6 | 776.2 | 1095.8 | 345.5 | Actual |
| 8 | 2021 | 753.9 | 696.5 | 1134.6 | 352.3 | Actual |
| 9 | 2022 | 765.6 | 755.1 | 1218.7 | 475.9 | Actual |
| 10 | 2023 | 820.3 | 847.5 | 1354.3 | 658.3 | Actual |
| 11 | 2024 | 873.5 | 874.1 | 1460.9 | 879.9 | Actual |
| 12 | 2025 | 916.1 | 996.7 | 1580.7 | 970.1 | Actual |
| 13 | 2026 | 966.4 | 1070.2 | 1676.4 | 1016.7 | Estimate |
| 14 | 2027 | 1205 | 1200.8 | 1771.1 | 1065.4 | Estimate |
| 15 | 2028 | 1323.2 | 1350.5 | 1864.4 | 1167 | Estimate |
| 16 | 2029 | 1341.6 | 1316.2 | 1957.3 | 1234.6 | Estimate |
| 17 | 2030 | 1348.8 | 1473.4 | 2052.1 | 1304.5 | Estimate |
| 18 | 2031 | 1369.1 | 1573.5 | 2151.5 | 1363.8 | Estimate |
| 20 | Note: 2026-2031 are OMB estimates. | |||||
Federal outlays by function, FY2015-FY2031 ($ billions)
- National Defense ($ billions)
- Medicare ($ billions)
- Social Security ($ billions)
- Net Interest ($ billions)
AI가 수치를 이중 확인했습니다: 2015년 국방비 589.7, 메디케어 546.2, 사회보장 887.8, 그리고 이자 비용 223.2(십억 달러) 모두 정부 수치와 일치합니다.
03 · 요청 2
이제 세 장의 슬라이드로 변환
분석가의 입력 내용
Now build a 3-slide PowerPoint for the Deputy Secretary from the 'Big Four' sheet:
1. Title slide: 'Interest costs vs. defense, Medicare and Social Security', subtitle 'FY2015-FY2031, OMB Historical Table 3.1 (FY2027 Budget)'.
2. The line chart, with a one-line headline stating what it shows, and 'Source: OMB Historical Tables, Table 3.1, FY2027 Budget; FY2026-2031 are estimates' at the bottom.
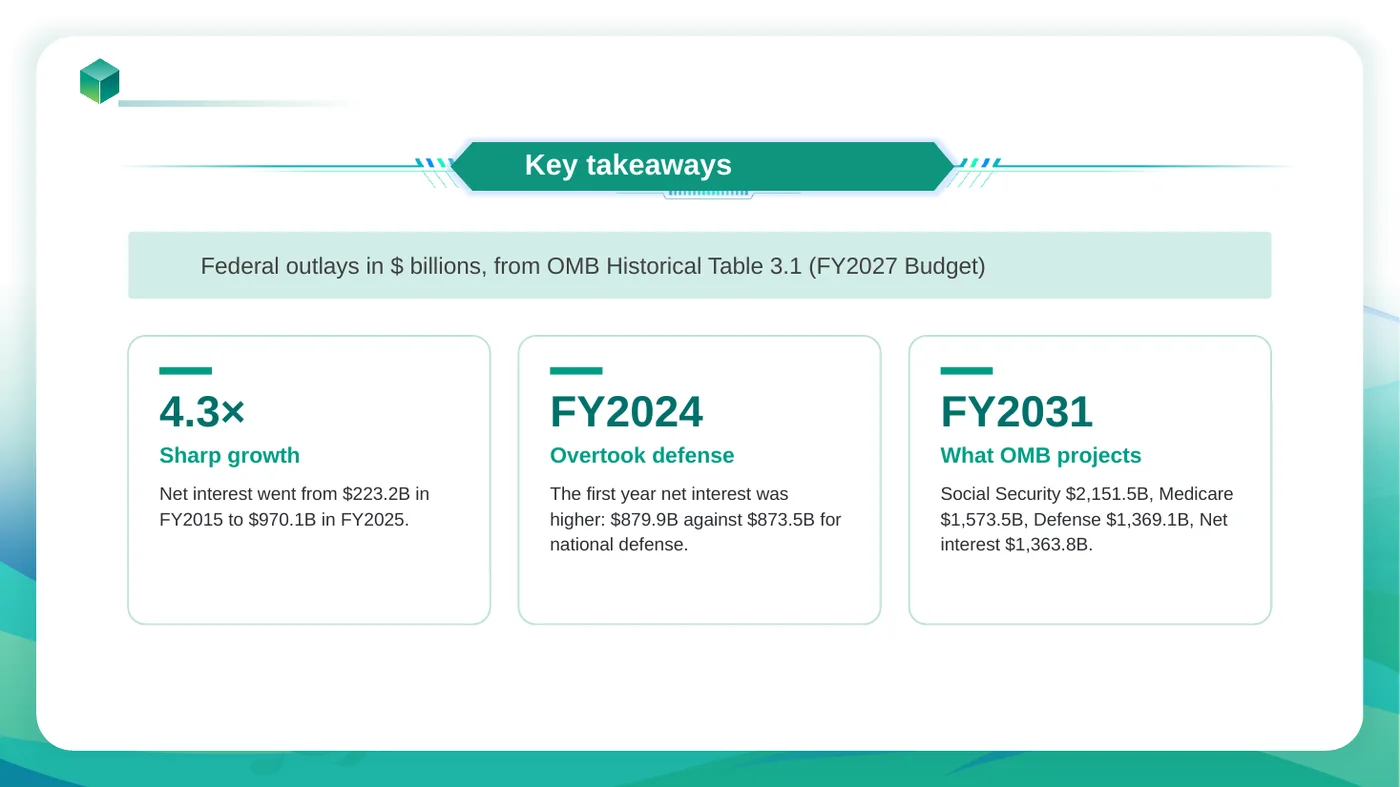
3. Three takeaways, each with figures from the sheet: (a) how net interest grew from FY2015 to FY2025; (b) the first fiscal year in which net interest exceeded national defense, with both amounts; (c) what OMB projects for the four lines in FY2031.

Plain government style, no stock images.
의 처리 내용
- 방금 만든 “Big Four” 시트를 읽어 슬라이드와 스프레드시트가 같은 숫자를 표시하도록 했습니다.
- 분석가가 템플릿 라이브러리에서 디자인을 선택할 수 있도록 했습니다.
- 데이터가 포함된 실제 PowerPoint 차트로 슬라이드 2에 차트를 배치했습니다. 마우스 오른쪽 버튼으로 클릭한 뒤 ‘데이터 편집’을 선택하면 됩니다.
- 숫자를 바탕으로 핵심 요점을 작성했습니다. 이자 비용은 2015년부터 2025년 사이 4.3배 증가했고, 2024년에 처음으로 국방비를 추월했습니다.
원래 위치에서 편집되는 파일
대부분의 AI 도구는 스프레드시트를 읽고 새 파일을 건네줍니다. 하지만 는 업로드한 파일을 열어 요청한 부분만 수정하고 이전의 모든 버전을 유지합니다.
계속 읽기