実例 · EXCELとPOWERPOINT
OMBの予算表をExcelグラフとブリーフィング資料に変換
ある予算アナリストが、1940年から2031年までの米国政府支出を収めたExcelファイルを受け取りました。上司向けに、主要な4つの支出項目を取り出してグラフ化するように依頼しました。
は、2015年から2031年までの国防、メディケア、社会保障、利払い費の表を作成してデータを分析し、同じExcelファイルにグラフを描きました。その後、そのグラフは画像ではなく本物のグラフとしてPowerPointのスライドに配置されました。
1アナリストがアップロードした元のExcelファイル
- 2平易な英語での依頼
- 1置き換えではなく編集したExcelファイル
- 1そこから構築されたスライドデッキ
- 0手入力された数式
実際のファイルを開く
これらは実行時の実際のファイルです。ダウンロードしてExcelまたはPowerPointで開いてください。
ファイルの出典: OMB Historical Tables, 表3.1、大区分および機能別の歳出、2027年度予算。
01 · 開始時のファイル
巨大で複雑な政府の表計算ファイル
このファイルには、1940年から2031年までのあらゆる連邦支出が1年1列で並び、合計94列あります。いくつか落とし穴があり、1976年の後に「TQ」列が追加で挟まっていることや、2025年以降の年が「2026年予測」などと表記されていることです。
589,659| A | B | … | AL | AM | AN | … | BZ | CA | … | CI | CJ | CK | … | CP | |
|---|---|---|---|---|---|---|---|---|---|---|---|---|---|---|---|
| 1 | Table 3.1 - OUTLAYS BY SUPERFUNCTION AND FUNCTION: 1940 - 2031 | … | … | … | … | ||||||||||
| 2 | Superfunction and Function | 1940 | … | 1976 | TQ | 1977 | … | 2015 | 2016 | … | 2024 | 2025 | 2026 estimate | … | 2031 estimate |
| 3 | In millions of dollars: | … | … | … | … | ||||||||||
| 4 | National Defense | 1,660 | … | 89,619 | 22,269 | 97,241 | … | 589,659 | 593,372 | … | 873,523 | 916,140 | 966,396 | … | 1,369,123 |
| 5 | Human resources | 4,139 | … | 203,594 | 52,065 | 221,895 | … | 2,706,828 | 2,820,292 | … | 4,548,904 | 4,706,716 | 5,078,303 | … | 6,347,219 |
| 6 | Education, Training, Employment, and Social Services | 1,972 | … | 18,910 | 5,169 | 21,104 | … | 122,035 | 109,709 | … | 306,370 | 72,042 | 101,970 | … | 133,413 |
| 7 | Health | 55 | … | 15,734 | 3,924 | 17,302 | … | 482,257 | 511,325 | … | 911,290 | 978,511 | 1,047,526 | … | 1,143,249 |
| 8 | Medicare | .......... | … | 15,834 | 4,264 | 19,345 | … | 546,202 | 594,536 | … | 874,133 | 996,718 | 1,070,248 | … | 1,573,538 |
| 9 | Income Security | 1,514 | … | 60,784 | 14,981 | 61,045 | … | 508,800 | 514,098 | … | 670,548 | 701,609 | 741,971 | … | 743,752 |
| 10 | Social Security | 28 | … | 73,899 | 19,763 | 85,061 | … | 887,753 | 916,067 | … | 1,460,918 | 1,580,673 | 1,676,441 | … | 2,151,475 |
| … | |||||||||||||||
| 22 | Net interest | 899 | … | 26,727 | 6,949 | 29,901 | … | 223,181 | 240,033 | … | 879,879 | 970,065 | 1,016,650 | … | 1,363,769 |
| … | |||||||||||||||
| 35 | Total, Federal outlays | 9,468 | … | 371,792 | 95,975 | 409,218 | … | 3,691,850 | 3,852,615 | … | 6,735,261 | 7,011,105 | 7,540,434 | … | 9,279,779 |
| … | |||||||||||||||
| 39 | National defense | 17.5 | … | 24.1 | 23.2 | 23.8 | … | 16.0 | 15.4 | … | 13.0 | 13.1 | 12.8 | … | 14.8 |
| 42 | Net interest | 9.5 | … | 7.2 | 7.2 | 7.3 | … | 6.0 | 6.2 | … | 13.1 | 13.8 | 13.5 | … | 14.7 |
02 · リクエスト1
「集計表とグラフを追加して」
アナリストが入力した内容
In the attached OMB Historical Table 3.1 (FY2027 Budget), please add a new sheet called 'Big Four' and leave the 'Table' sheet exactly as it is. On the new sheet:
1. Column A: fiscal years 2015 to 2031, one row per year (17 rows).
2. Columns B-E: National Defense (row 4), Medicare (row 8), Social Security (row 10) and Net interest (row 22) from the Table sheet, converted from $ millions to $ billions, one decimal. Use formulas that point at the Table sheet if you can.
3. Column F: 'Actual' for 2015-2025 and 'Estimate' for 2026-2031 (the columns headed '2026 estimate' to '2031 estimate').
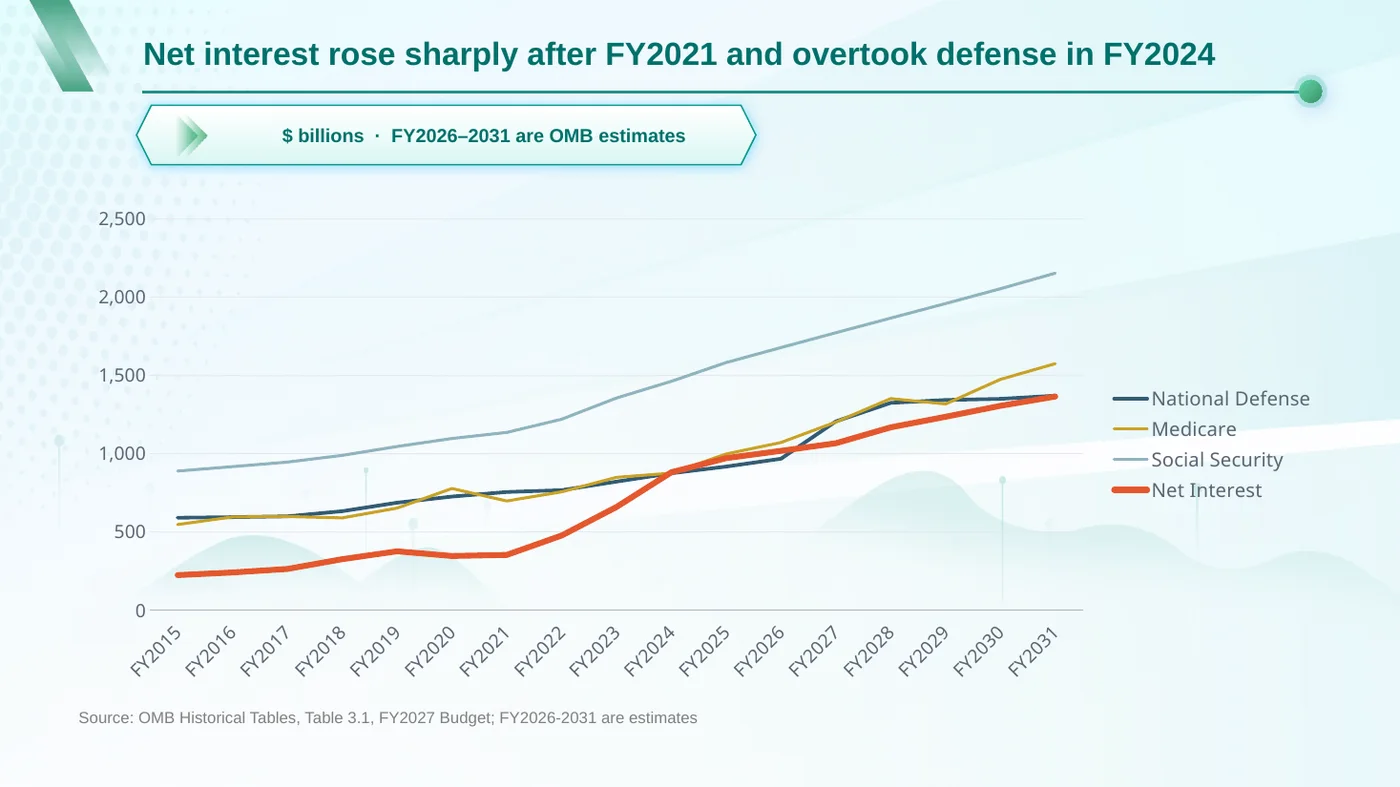
4. A native Excel line chart of the four series with years on the x-axis, titled 'Federal outlays by function, FY2015-FY2031 ($ billions)', with a note that 2026-2031 are OMB estimates.
の処理
- アップロードされたExcelファイル内で作業しました。新しいファイルは作成されませんでした。
- 追加の「TQ」列があるにもかかわらず2015年が正しい列に揃うよう、最初に年ラベルを確認しました。
- 新しいシート「Big Four」を追加:2015年から2031年までの各年が1行(計17行)、4つの支出項目の金額(十億ドル単位)、および「実績(Actual)」または「予測(Estimate)」のラベル。
- 元のシートを参照する数式を入力したため、すべての数値を追跡できます。下の緑色のセルをクリックして確認してください。
- クリックして編集できる実際のExcel折れ線グラフを作成しました。
- 元のシートには触れていません。すべてのセルを確認しました。
=ROUND(Table!BZ4/1000,1)| A | B | C | D | E | F | |
|---|---|---|---|---|---|---|
| 1 | Fiscal Year | National Defense ($ billions) | Medicare ($ billions) | Social Security ($ billions) | Net Interest ($ billions) | Type |
| 2 | 2015 | 589.7 | 546.2 | 887.8 | 223.2 | Actual |
| 3 | 2016 | 593.4 | 594.5 | 916.1 | 240 | Actual |
| 4 | 2017 | 598.7 | 597.3 | 944.9 | 262.6 | Actual |
| 5 | 2018 | 631.3 | 588.7 | 987.8 | 325 | Actual |
| 6 | 2019 | 685.7 | 651 | 1044.4 | 375.2 | Actual |
| 7 | 2020 | 724.6 | 776.2 | 1095.8 | 345.5 | Actual |
| 8 | 2021 | 753.9 | 696.5 | 1134.6 | 352.3 | Actual |
| 9 | 2022 | 765.6 | 755.1 | 1218.7 | 475.9 | Actual |
| 10 | 2023 | 820.3 | 847.5 | 1354.3 | 658.3 | Actual |
| 11 | 2024 | 873.5 | 874.1 | 1460.9 | 879.9 | Actual |
| 12 | 2025 | 916.1 | 996.7 | 1580.7 | 970.1 | Actual |
| 13 | 2026 | 966.4 | 1070.2 | 1676.4 | 1016.7 | Estimate |
| 14 | 2027 | 1205 | 1200.8 | 1771.1 | 1065.4 | Estimate |
| 15 | 2028 | 1323.2 | 1350.5 | 1864.4 | 1167 | Estimate |
| 16 | 2029 | 1341.6 | 1316.2 | 1957.3 | 1234.6 | Estimate |
| 17 | 2030 | 1348.8 | 1473.4 | 2052.1 | 1304.5 | Estimate |
| 18 | 2031 | 1369.1 | 1573.5 | 2151.5 | 1363.8 | Estimate |
| 20 | Note: 2026-2031 are OMB estimates. | |||||
Federal outlays by function, FY2015-FY2031 ($ billions)
- National Defense ($ billions)
- Medicare ($ billions)
- Social Security ($ billions)
- Net Interest ($ billions)
AIによる数値の二重チェック: 2015年の国防費589.7、メディケア546.2、社会保障887.8、利払い223.2(いずれも十億ドル)は、すべて政府の数値と一致しています。
03 · リクエスト2
「これを3枚のスライドにして」
アナリストが入力した内容
Now build a 3-slide PowerPoint for the Deputy Secretary from the 'Big Four' sheet:
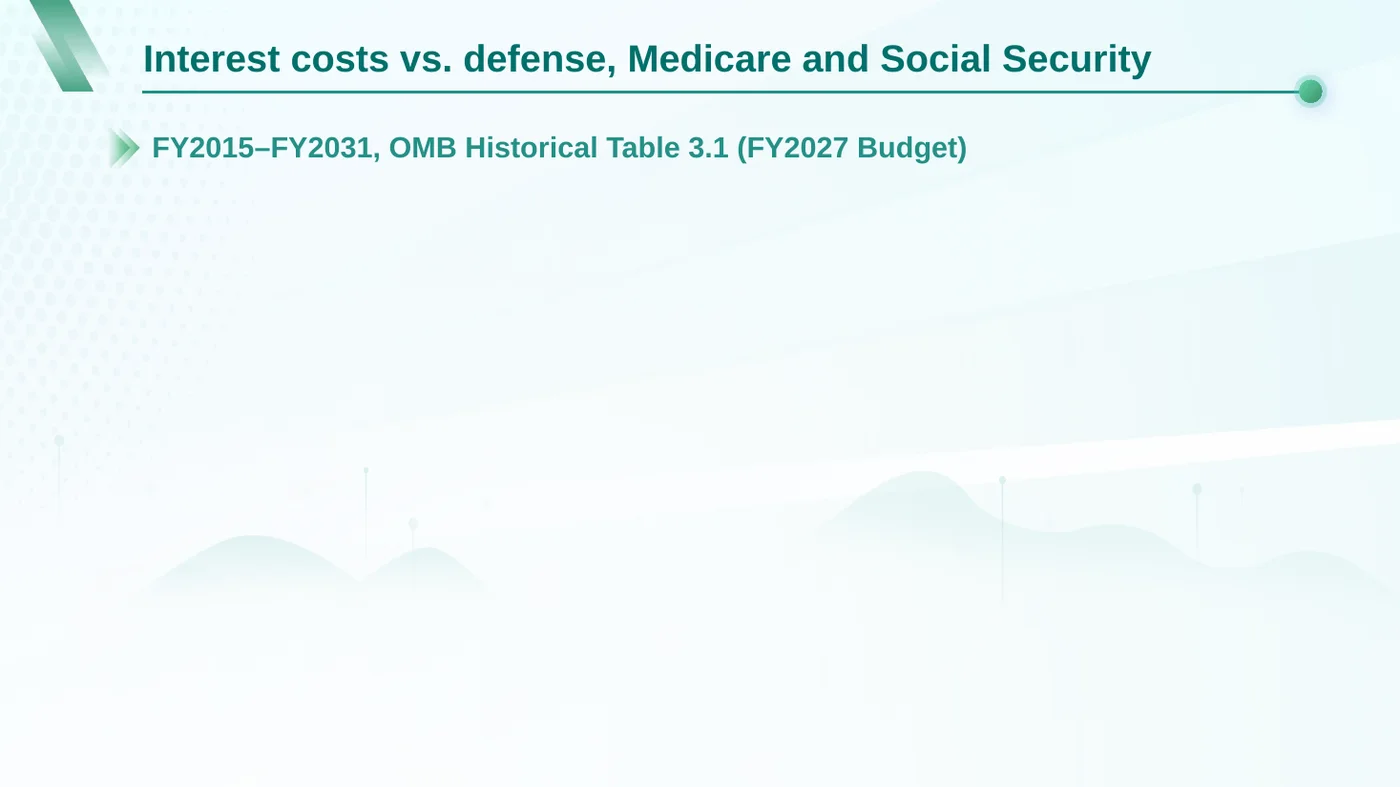
1. Title slide: 'Interest costs vs. defense, Medicare and Social Security', subtitle 'FY2015-FY2031, OMB Historical Table 3.1 (FY2027 Budget)'.
2. The line chart, with a one-line headline stating what it shows, and 'Source: OMB Historical Tables, Table 3.1, FY2027 Budget; FY2026-2031 are estimates' at the bottom.
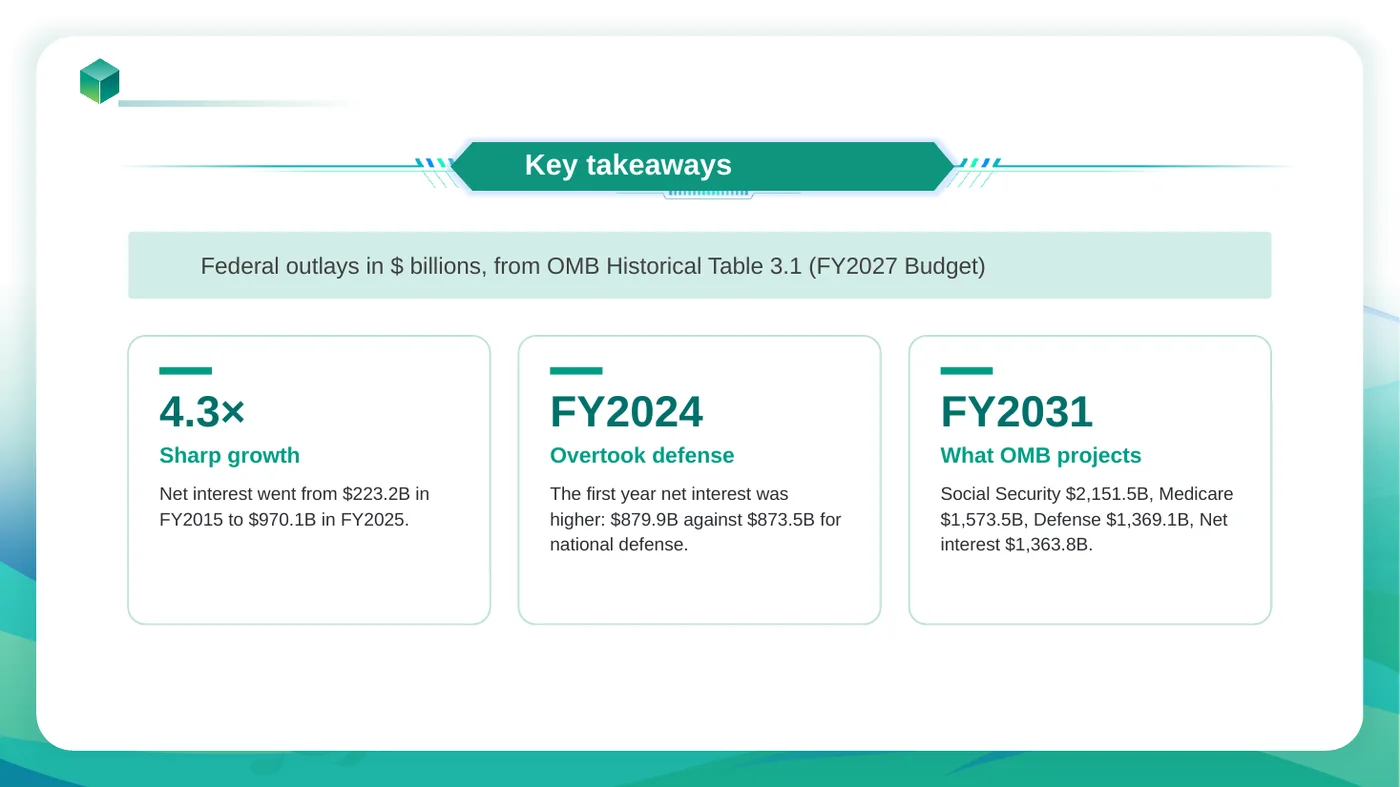
3. Three takeaways, each with figures from the sheet: (a) how net interest grew from FY2015 to FY2025; (b) the first fiscal year in which net interest exceeded national defense, with both amounts; (c) what OMB projects for the four lines in FY2031.

Plain government style, no stock images.
の処理
- 作成したばかりの「Big Four」シートを読み込み、スライドとスプレッドシートに同じ数値が表示されるようにしました。
- アナリストがテンプレートライブラリからデザインを選択できるようにしました。
- データを内包した実際のPowerPointグラフとして、スライド2にグラフを配置しました。右クリックして「データの編集」を選択できます。
- 数値から導き出した重要なポイントを記述しました:純利払いは2015年から2025年にかけて4.3倍に増加し、2024年には初めて国防費を上回りました。
ファイルはそのままの場所で編集
ほとんどのAIツールはスプレッドシートを読み取って新しいものを返しますが、はアップロードされたファイルを開き、要求された部分だけを変更し、以前のすべてのバージョンを保持します。
続きを読む